

The spending patterns of the US tech industry implicitly constitute a bet on the Singularity coming soon. More precisely, one might say they constitute a bet that AI is going to become majorly economically transformative relatively soon—either through a breakthrough to human-level AGI, or at least due to smaller breakthroughs in applied AI leading to widespread and highly impactful adoption.
And the bet being placed is frickin’ enormous. The four largest hyperscalers have guided to roughly $730 billion of capital spending for 2026, and analysts expect $1.2 to $1.3 trillion in 2027. Companies raised about $466 billion of AI-related debt in the first nine months of 2026, according to Morgan Stanley data reported by the Financial Times. Spending on that scale only makes sense if machines will soon do a large share of human cognitive work.
(China is making a similar bet in its own way, but in this article I’ll focus on the US in particular…)
One also sees plenty of pundits shouting that this is all a losing bet and “the AI bubble is bound to burst!” Most of these bubble alarmists, though, are making this call because they think AI progress is going to slow down. Or at best they think that, even if AI keeps advancing in some regards, practical adoption of AI to yield economic value will be sluggish because it will keep needing so much assistance to do the really critical human tasks.
While I think this pessimistic view about AI advancement is wrong, I can see why folks holding this pessimistic technology-progress view would also be economically pessimistic. I mean, it’s fairly clear that, IF AI badly underdelivers in terms of practical utility over the next 5 years or so, THEN the current massive investments in AI infrastructure will not pay off and will lead to some serious economic issues. But that’s just not an observation that interests me greatly, because I think it’s highly likely that the capability of AI is going to continue to increase rapidly.
What is slightly more interesting to me is the adjacent question: Could Big Tech’s financial management practices cause a major economic disruption even in scenarios where they are RIGHT about, say, AGI being near?
I took a first pass at exploring this territory back in August, in a post called Big Tech’s Big Bets on the Singularity. There I walked through three scenarios for AI progress using plain back-of-the-envelope accounting, and concluded that a decent-sized financial crash in the next couple of years was the modal outcome whether HLAGI arrives in 2029, in 2035 or much later. I also looked at how the picture changes if decentralized AGI networks get out in front of Big Tech.
This post is a deeper look at those future scenarios where the AI technology bet pays off. Instead of three fixed revenue curves racing a fixed schedule of obligations, I use a small simulation in which revenue is uncertain and the builders adjust their spending as they learn. The August analysis turns out to be one particular setting of the simulation’s dials, and decentralized AI is another. Both are among the nine examples below, along with the thing my August post was mostly about: how much of the bet is made with borrowed money. As you’ll see, the deeper look agrees with August on some points and pushes back on others.
Suppose, for example, AI capabilities keep advancing quickly and HLAGI (human-level AGI) arrives somewhere between 2028 and 2035. In such scenarios, multiple factors could still cause serious financial and troubles for Big Tech and thus the economy as a whole in the transition period between here and HLAGI.. Most obviously:
- Timing. The builders may be a little too optimistic about how soon the revenue shows up.
- Inertia. Until HLAGI is fully here, adoption is slow and erratic, because organizations, regulation, and habits change more slowly than models do. Once it arrives, I assume adoption speeds up sharply.
The cost of getting the timing wrong is closely tied to the depreciation of all this hardware being bought at such great expense. Hardware being bought today wears out or goes obsolete in about five years. So being right about the destination and two years early on the schedule can still be very expensive for a Big Tech.
Put simply, what if HLAGI comes in 2032, but Big Tech has bet everything on HLAGI coming in 2030 or sooner? What if a company has borrowed money in 2027 to buy servers that will become obsolete by 2031?—and what if the software available before 2031 is cool but not THAT useful in the end, so it doesn’t generate much profit. Then this company has wasted all their money and potentially gone into crippling debt during the interval when AI is exciting but not yet economically superpowerful… so that by the time the AGI really swings into gear they may be out of business due to all their debt!
Similar phenomena occurred in the era of the dot-com boom, of course. The level of capex was generally smaller then, but the same dynamic existed. Numerous startups went through their funding rounds and spent all their money building and trying to sell Internet products at a time when the Internet wasn’t quite ready to generate profits for a wide variety of businesses. Then by the time the Internet technology and market matured, these companies were gone. My own New York dot-com era company Webmind Inc. fit this bill to an extent—but we were very far ahead of our time, pursuing decentralized AGI in the 1990s. A clearer example was my friend Cliff Rosen’s company Six Degrees (also NYC based)—which was basically LinkedIn a few years before LinkedIn. If they had just waited a few more years they could have had the success LinkedIn eventually found—but they couldn’t raise the needed money to keep going after the market crashed in 2001.
Another difference between the dot-com boom and the current situation, though, is the speed with which things are now evolving. The same dynamic, operating with different rates, can have radically different practical implications. For instance, consider the dynamic of “AI summers followed by AI winters”— where investors get excited about AI’s potential, invest a lot, then get overexcited, then get disappointed when things don’t develop as fast as hoped, then withdraw funding, and lather, rinse repeat. This cycle has been happening since the 1960s, but the speed of oscillation has vastly increased. Remember Fall 2024 when AI progress was supposed to be stalled—and then OpenAI released the o1 model, the first “reasoning model.” Then when GPT-5 came out and was a little underwhelming, the era of rapid AI progress was over—until Claude Fable 5 and Opus 5.5 and OpenAI 5.6 Astra came along and delivered revolutionary functionality that transformed multiple areas of science and engineering. Etc. The thing is, when the swing from summer to winter to summer again comes so far, there is not enough time between peaks for that many companies to go bankrupt, or that many people to give up on their passion and change careers, etc.
In a similar way, even if Big Tech now is blowing up their capex betting on HLAGI coming in year N but then it actually comes in year N+1 or N+2, it may be this difference is short enough that they can paper over the gap with fancy financial footwork and then still be around and healthy enough when HLAGI comes “two years late.”
Or maybe not—maybe the two years of owing a lot of money and not making enough money could be enough to cause the company very serious problems and even put it out of business.
There is always the possibility of government bailing out failing tech companies on the grounds that they’re “too big to fail” or too critical to national security to fail—which can have complex economic consequences depending on the details. I’ll set these possibilities aside at first, and look at the financial dynamics of tech companies in themselves without major government intervention. Then, in the last of the examples, I’ll add a simple dial for the government’s readiness to bail the builders out, and see what it changes. The main question I want to look at is: Given the practice of borrowing a lot of money to buy compute, and the fairly rapid depreciation of compute, how possible is it that companies making the strategically correct bet on the near-term emergence of AGI will still get financially killed by making the wrong guess about the precise timing of HLAGI emergence?
To put rough numbers on this phenomenon – on the economic-dynamics implications of compute hardware expenditure and depreciation – I asked the redoubtable Claude Fable 5.2 to put together a small simulation model. It is a toy model, not a real economic simulation, but it makes the logic explicit and lets you change the assumptions yourself. I found it reasonably helpful for thinking through these questions.
Along the way the model grew to cover three things that the bare timing question leaves out: what happens when the builders’ lenders get dragged down with them, what a government bailout would and would not fix, and what changes if decentralized AI networks take a good part of the market. A preview of where it comes out: debt matters nearly as much as optimism does. A bailout buys a lot of safety for the wider economy, at a price in the trillions, and none for the builders. And decentralized networks make the first couple of years rougher and the later years safer. Overall, a depression looks unlikely, a full-on crash is possible, and waves of more moderate disruption are the most likely thing.
Overall I am reminded of some words of wisdom my daughter Zadi told me when she was around 14 years old: “The best answer to every question is always ‘it depends’”. That may be a bit of an overstatement (it depends!), but in case of the question I’m asking here it’s extremely apropos. The “inevitable economic doom” notion is clearly overblown – it’s not even “inevitable doom unless the technology-progress guesses are totally on the mark.” It’s all a lot more complex than that, and in the scenarios where Big Tech’s technology progress guesses are moderately but not extremely wrong, there is a wide variety of plausible outcomes depending on a host of different factors. That may not be an emotionally satisfying answer but it seems to be the reality. What I’ll aim to do here is give the reader with some stamina a sense of how the different factors involved seem to interrelate in terms of driving the economic outcome of the bets Big Tech is making on AI.
The toy model’s assumptions, informally
The model Fable and I came up with is basically a race between two clocks: revenue from AI, and the capital spending (on rapidly depreciating assets) made in anticipation of it. I made eleven assumptions to drive the model:.
- AI revenue keeps growing, but the growth rate decays. Revenue never shrinks, because capabilities keep improving. The growth rate halves every few years as the base gets larger, until HLAGI arrives.
- Adoption is erratic. Each year’s growth is hit by a random shock, and bad years tend to follow bad years. The shocks are largest while growth is fastest.
- Nobody knows how fast growth will fade. Each simulated future has its own true half-life for the growth rate. Planners start with a spread of guesses and learn from each year’s data, which is slow because the data is noisy.
- Planners build ahead of demand, with some optimism. They size capacity for the revenue they expect a year after it is installed, and they overestimate growth by a fixed percentage.
- Capital is short-lived. Chips and data-centre equipment are retired after about five years, so each vintage must earn its keep quickly.
- Spending plans are sticky. Contracts and construction schedules mean that planners close only part of the gap between current and desired spending each year.
- Trouble comes from overcapacity. When installed capacity runs far ahead of the revenue available to pay for it, compute prices fall and somebody takes losses: first shareholders, then leveraged lenders, then in the worst cases the wider financial system.
- Decentralized AI may take a share. Optionally, decentralized AI networks capture a growing share of AI revenue. Total revenue is unchanged, the networks carry no debt, and the incumbents’ planners do not see the loss coming. All of the trouble counted below is on the incumbents’ side.
- The wider economy feels dollars, not ratios. Each year I add up two amounts: newly stranded capital that nobody can put to use, and the cut in that year’s AI capital spending. Where decentralized networks exist, they can take over stranded hardware, up to half of the capacity their own revenue supports. I compare the total with the size of the US economy.
- The government may step in. With some probability the government is the kind that bails the builders out. If it is, then whenever the hit to the economy gets large it absorbs half of it, at the public’s expense.
- Debt decides who takes the losses. Optionally, part of the buildout is in levered hands. The more debt those builders carry, the smaller the glut at which their lenders start to lose. After a credit event, the borrowed part of next year’s spending disappears. And if the lenders’ losses outgrow their cushion, the damage spreads to the rest of the economy.
I then look at four kinds of financial trouble that might occur and ask how likely each is to happen at least once before HLAGI arrives. Later arrival means more years of exposure, thus all else equal increasing the odds of trouble in the interim. The four kinds of trouble I consider are:
- Equity correction. AI-related stocks fall sharply because results disappoint, with a drop of roughly 30% or more in mind. Shareholders lose, but companies keep operating and nobody defaults. In the model it is triggered when installed capacity exceeds 1.4 times what revenue can support, or when a capex bust occurs. It also carries an 8% chance each year from causes unrelated to AI, such as interest rates or geopolitics.
- Capex bust. The companies building data centres cut their capital spending by 20% or more in a single year. The builders themselves survive, but their suppliers are hit hard: chip makers, equipment vendors, construction firms, and power developers all see orders collapse. The model does not use a threshold for this one. It emerges on its own, because spending depends on how fast revenue is growing, so even a slowdown in growth is enough to cause a cut.
- Credit event. Borrowers who financed AI infrastructure with debt cannot make their payments, and lenders take losses. The most exposed are leveraged firms that rent out compute, since a glut pushes rental prices down while their debt payments stay fixed. In the model it is triggered when capacity exceeds 1.6 times what revenue can support. That is the point at which a builder financed 62.5% by debt is worth less than it owes. A dial lets you change the debt share, and the trigger moves with it.
- Systemic stress. The glut is deep enough that losses could spread beyond the AI sector to banks, insurers, and private credit funds, and from there to the wider economy. In the model it is triggered when capacity exceeds 1.9 times what revenue can support. This is the crudest of the four definitions: the model has no financial system in it, so this measures only that the conditions for contagion exist, not that contagion happens.
Those four are all trouble inside the AI complex itself. To ask whether the trouble is big enough to matter for the economy as a whole, I track three more things:
- Lenders’ cushion breached. Lenders’ losses on the levered part of the buildout exceed what they can absorb, which I set at 1% of GDP. Past that point lenders pull back from everyone, and each further dollar of loss does extra damage to the wider economy. This is only tracked when the levered share is switched on.
- Economy-wide crisis. The combined hit from stranded capital and spending cuts reaches 3% of US GDP in a single year, after any bailout. This one is about scale, not ratios. A badly overbuilt AI sector that is still small does limited damage to everyone else, and a mildly overbuilt one that has grown huge can do a lot. The 3% bar is my judgment call.
- Government bailout. The government is the bailing-out kind, and the hit reaches 1.5% of GDP in some year. It then absorbs half of that hit. I track how often this happens and what it costs.
These are far from the only things that can go wrong in an economy, but they’re top of the list in terms of potential adverse economic consequences of excessively optimistic bets on progress toward HLAGi.

The toy model, in equations
The simple math model Fable and I set up runs in yearly steps from 2027. It runs 4000 simulated paths through the years 2027-2035, each involving some random choices based on the given assumptions. For each random choice it runs through the following equations (note that in the following explanations, money is in billions of dollars a year.)
–Scroll past the equations if you don’t like them!–
Revenue. Each path draws a true half-life h for the growth rate from a lognormal spread around a median. Trend growth decays with that half-life, a persistent shock u multiplies it, and total AI revenue R compounds from a starting level R0 at the end of 2026 (250 by default).


Decentralized share. Decentralized networks take a share s of that revenue. It rises in a straight line from zero in 2026 to D in year T_D and stays there. The incumbents, meaning today’s debt-funded builders, keep the rest.

Capital. The stock S is the last L years of capex K. Each dollar of revenue supports kappa dollars of stock, where m is the share of revenue available to service capital and r is the cost of capital.

Learning. Planners hold weights w over 15 candidate half-lives, starting from the prior. Each year they update by Bayes’ rule on observed growth, treating the shock as independent noise.

Planning. Planners forecast their own revenue two years out, inflated by an optimism bias b. They do not anticipate losing further share. They want enough stock to match that forecast, and they close a fraction lambda of the gap each year.


Stress. Overcapacity X compares the installed stock with what next year’s true trend revenue, net of the decentralized share, can support.

Debt. The levered builders finance a share theta of their assets with debt. Their assets are worth what revenue can support, which is the stock divided by X. So they are worth less than the debt once X passes 1/theta. That is the credit-event point, and at the default theta = 62.5% it is 1.6.
The hit to the economy. Stranded capital is the part of the incumbents’ stock beyond 1/theta times what next year’s trend revenue can support. Decentralized networks take over some of it, up to a share alpha of the capacity their own revenue supports. What is left, U, is unusable.

Lenders and the sudden stop. A share phi of the buildout is in levered hands, so lenders bear J, which is phi times theta times the unusable capital. E is the part of their losses beyond a cushion of 1% of GDP. After any year with a credit event, the borrowed part of next year’s capex is cut off.

The hit H adds the year’s increase in unusable capital to the cut in capex, plus c dollars for every new dollar of lenders’ losses beyond the cushion, and divides by GDP. GDP is 33,000 in 2026, grows 5% a year, and also includes AI revenue above today’s level.

Bailout. Each path draws once whether the government is the bailing-out kind, with probability p. If it is, then in any year when H reaches 1.5% it absorbs half of the hit: H is halved, and the other half is added to the cost of the bailout.
The events are defined on X, on capex, on E, and on E, and on H:
| Event | Definition |
|---|---|
| Capex bust | Capex falls 20% or more in one year |
| Equity correction | X above 1.4, or a capex bust, or an 8% a year chance from causes unrelated to AI |
| Credit event | X above 1/theta, which is 1.6 at the default debt share |
| Systemic stress | X above 1.9 |
| Lenders’ cushion breached | E above zero, meaning lenders’ losses exceed 1% of GDP |
| Economy-wide crisis | H at or above 3%, after any bailout |
| Government bailout | Government is the bailing-out kind, and H at or above 1.5% |
The fixed constants are m = 0.5, r = 8%, shock persistence rho = 0.5, and a rough AI capex history of 40, 80, 150, 300, and 600 for 2022 to 2026. For the economy-wide measure they are the absorption share alpha = 0.5, a crisis bar of 3% of GDP, a bailout trigger of 1.5% of GDP, bailout coverage of one half, and a lenders’ cushion of 1% of GDP. The sliders control the other fourteen parameters. Their defaults are starting revenue R0 = 250, growth g0 = 120%, median half-life 2 years, half-life spread 0.4, volatility sigma = 0.45, optimism b = 15%, asset life L = 5 years, flexibility lambda = 0.6, decentralized share D = 0, bailout propensity p = 0, debt share theta = 62.5%, levered share phi = 0, and contagion multiplier c = 0. When D is switched on, the default for T_D is 2029.
Play with the model yourself!
Mindplex does not give an easy way for me to embed software widgets in a post. However if you click through to the linked interactive model you can fiddle with the simple model yourself. Every slider reruns all 4,000 paths and plots the statistical conclusions!
Where to start: how much AI revenue is there today?
Before the examples, one dial needs defending: the amount of AI revenue today. The model’s default is a run rate of $250 billion a year at the end of 2026. In my August post I used about $100 billion.The two numbers measure different things. My August figure of about $100 billion was, in effect, the revenue the AI-native companies would book over the whole of 2026. The model needs something else: the annual run rate at the end of 2026, for all the AI revenue that helps pay for the buildout. When revenue multiplies within a single year, those two are far apart.
Here is what the public numbers look like as of mid-November:
| Measure | Roughly | What it counts |
|---|---|---|
| Revenue booked over 2026, OpenAI plus Anthropic | About $90 billion | OpenAI expects about $35 billion for the year. Anthropic booked about $33 billion in its first three quarters, $17 billion of it in the third. |
| Run rate this autumn, the same two labs | About $130 billion | OpenAI about $50 billion at the end of September, Anthropic $81 billion at the end of October. Anthropic counts sales billed by its cloud partners. OpenAI counts only its own share. |
| The cloud providers’ own AI lines | Over $60 billion | Microsoft’s AI business passed a $37 billion run rate in April, and AWS’s passed $25 billion in July. Both overlap with the labs, whose models they resell. |
| Cloud revenue above the pre-AI trend, per Goldman Sachs | About $70 billion a year in mid-2026 | What the clouds collect that they would not have collected without AI, including compute rented to the labs. |
Sources: TechCrunch and a Luminix compilation for the labs, the Microsoft and Amazon earnings releases, and Goldman Sachs’s September note.
Nobody can add these up cleanly, because the same dollar is often counted once at a lab and again at its cloud provider. My reading is this. By December the two labs alone should be at a run rate of $150 billion or more, if their recent growth holds. The non-overlapping part of everyone else’s AI revenue, such as Copilot subscriptions, Google’s own models, and enterprise workloads on the clouds, adds something like $50 to $100 billion. That puts the end-of-2026 run rate somewhere between $200 and $300 billion.
So $250 billion is a reasonable middle, and $100 billion is too low for what the model needs. My August number was fair as a count of booked revenue. It was the wrong kind of number to start a run-rate model from. Example 4 below shows what starting from the lower number does to the results.
Nine examples
Now let’s run through nine simple examples of what the model predicts given different assumptions, obtained by me fiddling with the sliders on the app…. Each chart shows the chance that an event happens at least once by the end of a given year, according to the simple example corresponding to the chars. Read the horizontal axis as the year HLAGI arrives.
The first three examples vary how careful the builders are. The fourth uses the gloomier revenue numbers from my August post. The fifth lets decentralized AI take market share. The next three bring in debt: how much the builders borrow, and what happens when their lenders get hurt. The last adds a government bailout.
Here are the nine side by side, for HLAGI arriving in 2031. The examples themselves give the picture for other arrival dates. A dash means the lenders’ side of the model is switched off in that example.
| Example | What changes | Credit event | Lenders’ cushion breached | Economy-wide crisis |
|---|---|---|---|---|
| 1. Baseline | Nothing: every dial at its default | 49% | – | 31% |
| 2. Disciplined planners | Less optimism, a more readable future | 1% | – | 5% |
| 3. Exuberant planners | More optimism, a less readable future | 84% | – | 65% |
| 4. August revenue numbers | Revenue starts at $100 billion and grows 50% a year | 100% | – | 0% |
| 5. Decentralized AI | Networks take 40% of AI revenue by 2028 | 91% | – | 22% |
| 6. Leverage switched on | Builders 75% debt-funded, 45% of the buildout levered | 83% | 19% | 48% |
| 7. Less debt | As 6, with builders 50% debt-funded | 11% | 0% | 20% |
| 8. Full Kelly | Exuberant planners with the debt of 6 | 95% | 62% | 80% |
| 9. Government bailout | Baseline, with a certain bailout | 49% | – | 10% |
Example 1: Baseline
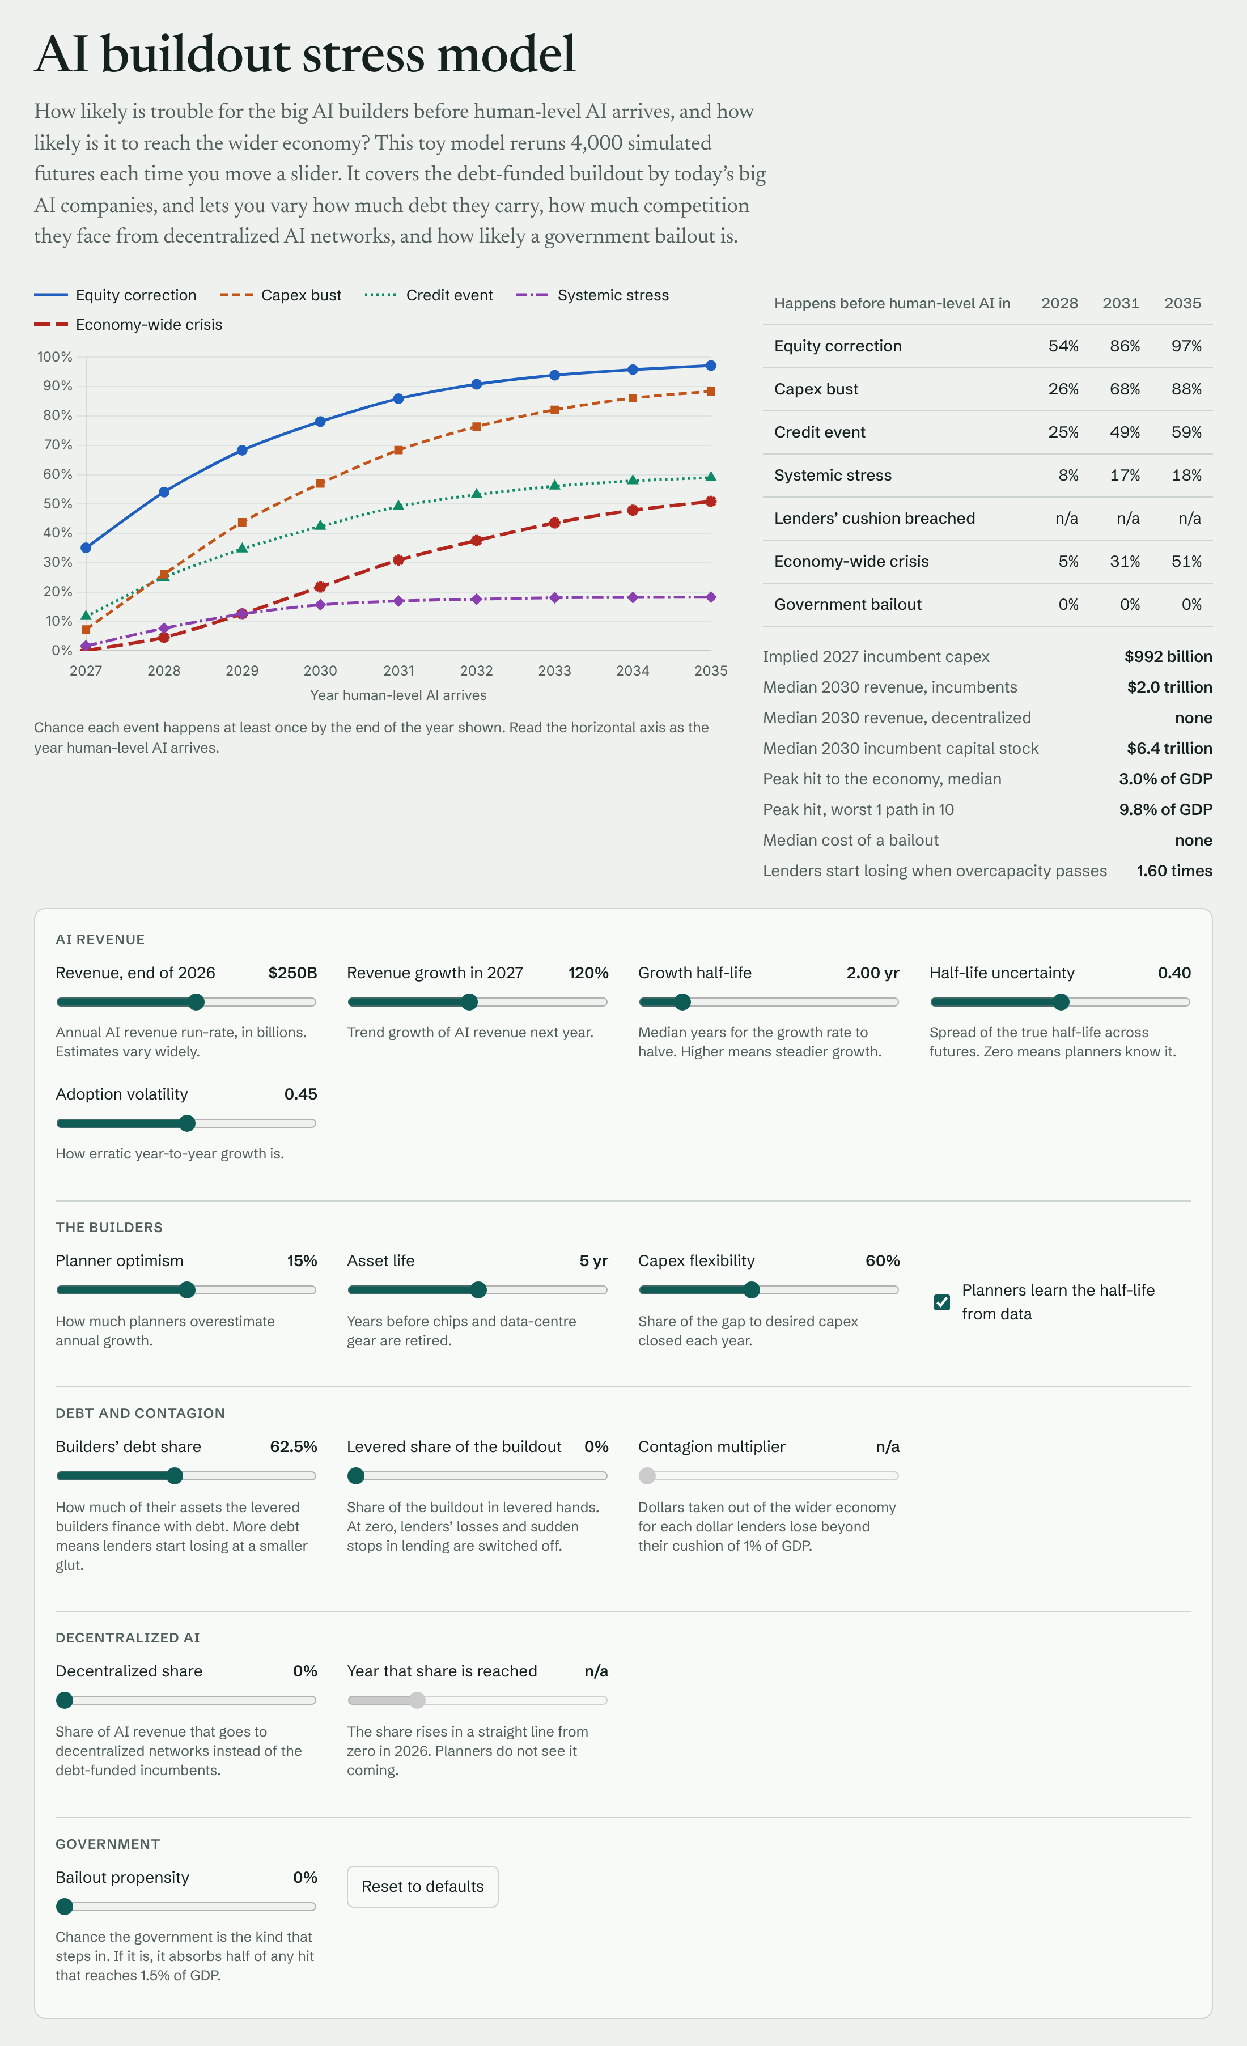
This is the reference case, with every dial at its default. Each of the other eight examples changes a few of them. The lenders’ side of the model is switched off here, and Example 6 switches it on.
The default settings—which Fable 5.2 thinks are most plausible—imply about $1.0 trillion of AI capex in 2027, close to the AI-specific share of analyst forecasts. If HLAGI arrives in 2028, a credit event has a 25% chance and systemic stress 8%. If it arrives in 2035, those rise to 59% and 18%, and a capex bust is very likely at 88%. For the economy as a whole, the chance of a crisis-sized hit is 5% if HLAGI arrives in 2028, 31% for 2031, and 51% for 2035.
Example 2: Disciplined planners
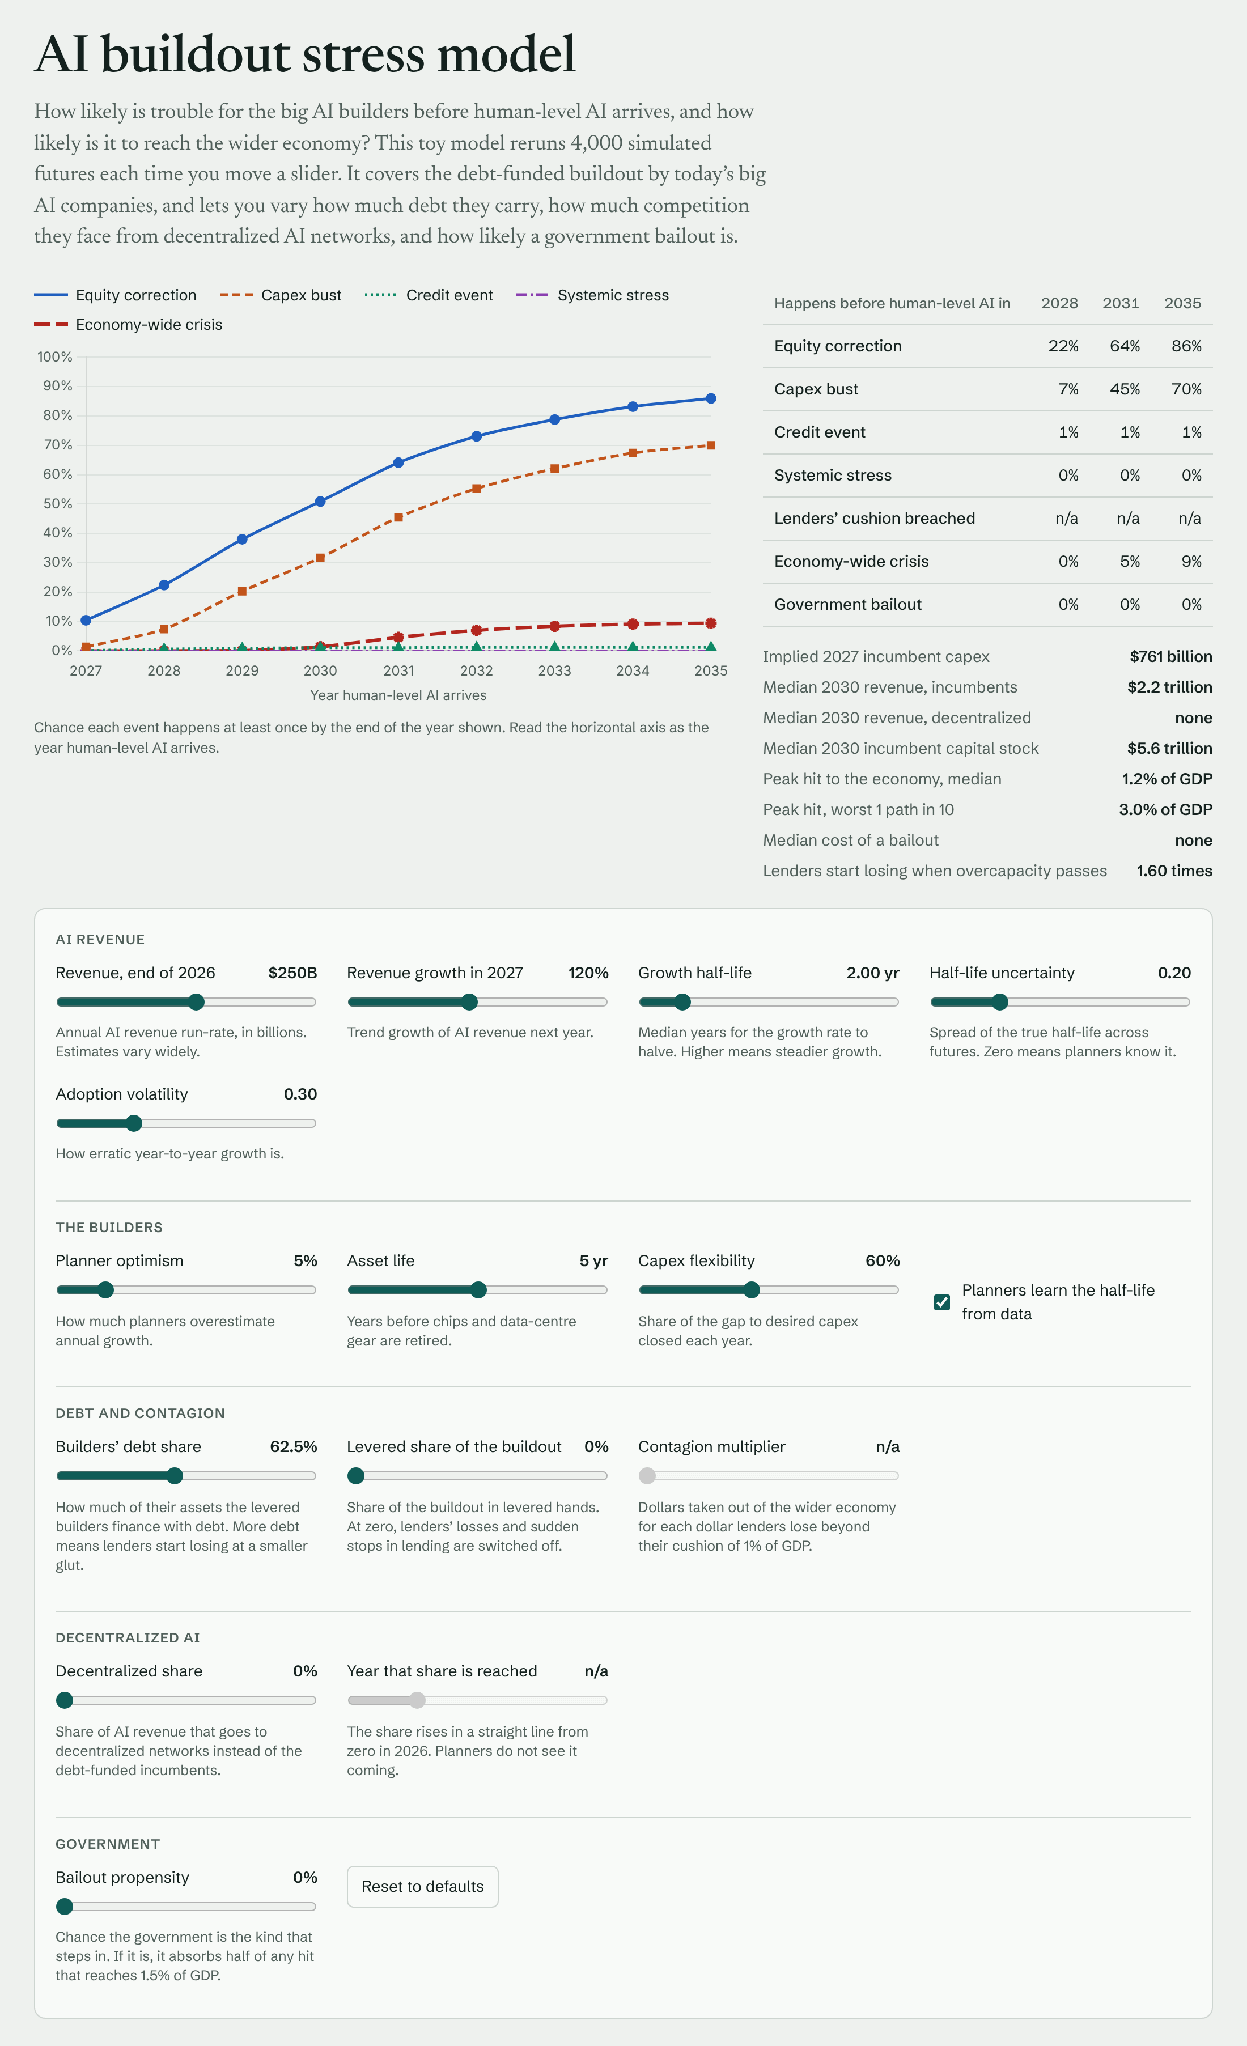
What if the builders are careful? This example makes them less optimistic, in a world that is easier to read.
Here optimism drops to 5%, the half-life spread to 0.2, and volatility to 0.3. Credit events and systemic stress nearly disappear, at about 1% and 0%. Capex busts still reach 70% by 2035, because capital spending follows the growth of revenue, and growth slows in every scenario. The chance of an economy-wide crisis stays under 10% throughout.
Example 3: Exuberant planners
And the opposite case: builders who are more optimistic, in a world that is harder to read.
Here optimism rises to 25%, the half-life spread to 0.6, and volatility to 0.6. A credit event becomes likely even with early HLAGI, at 56% by 2028 and 94% by 2035. Systemic stress reaches 35% by 2028 and 76% by 2035. An economy-wide crisis follows the same pattern, at 25% by 2028 and 86% by 2035.
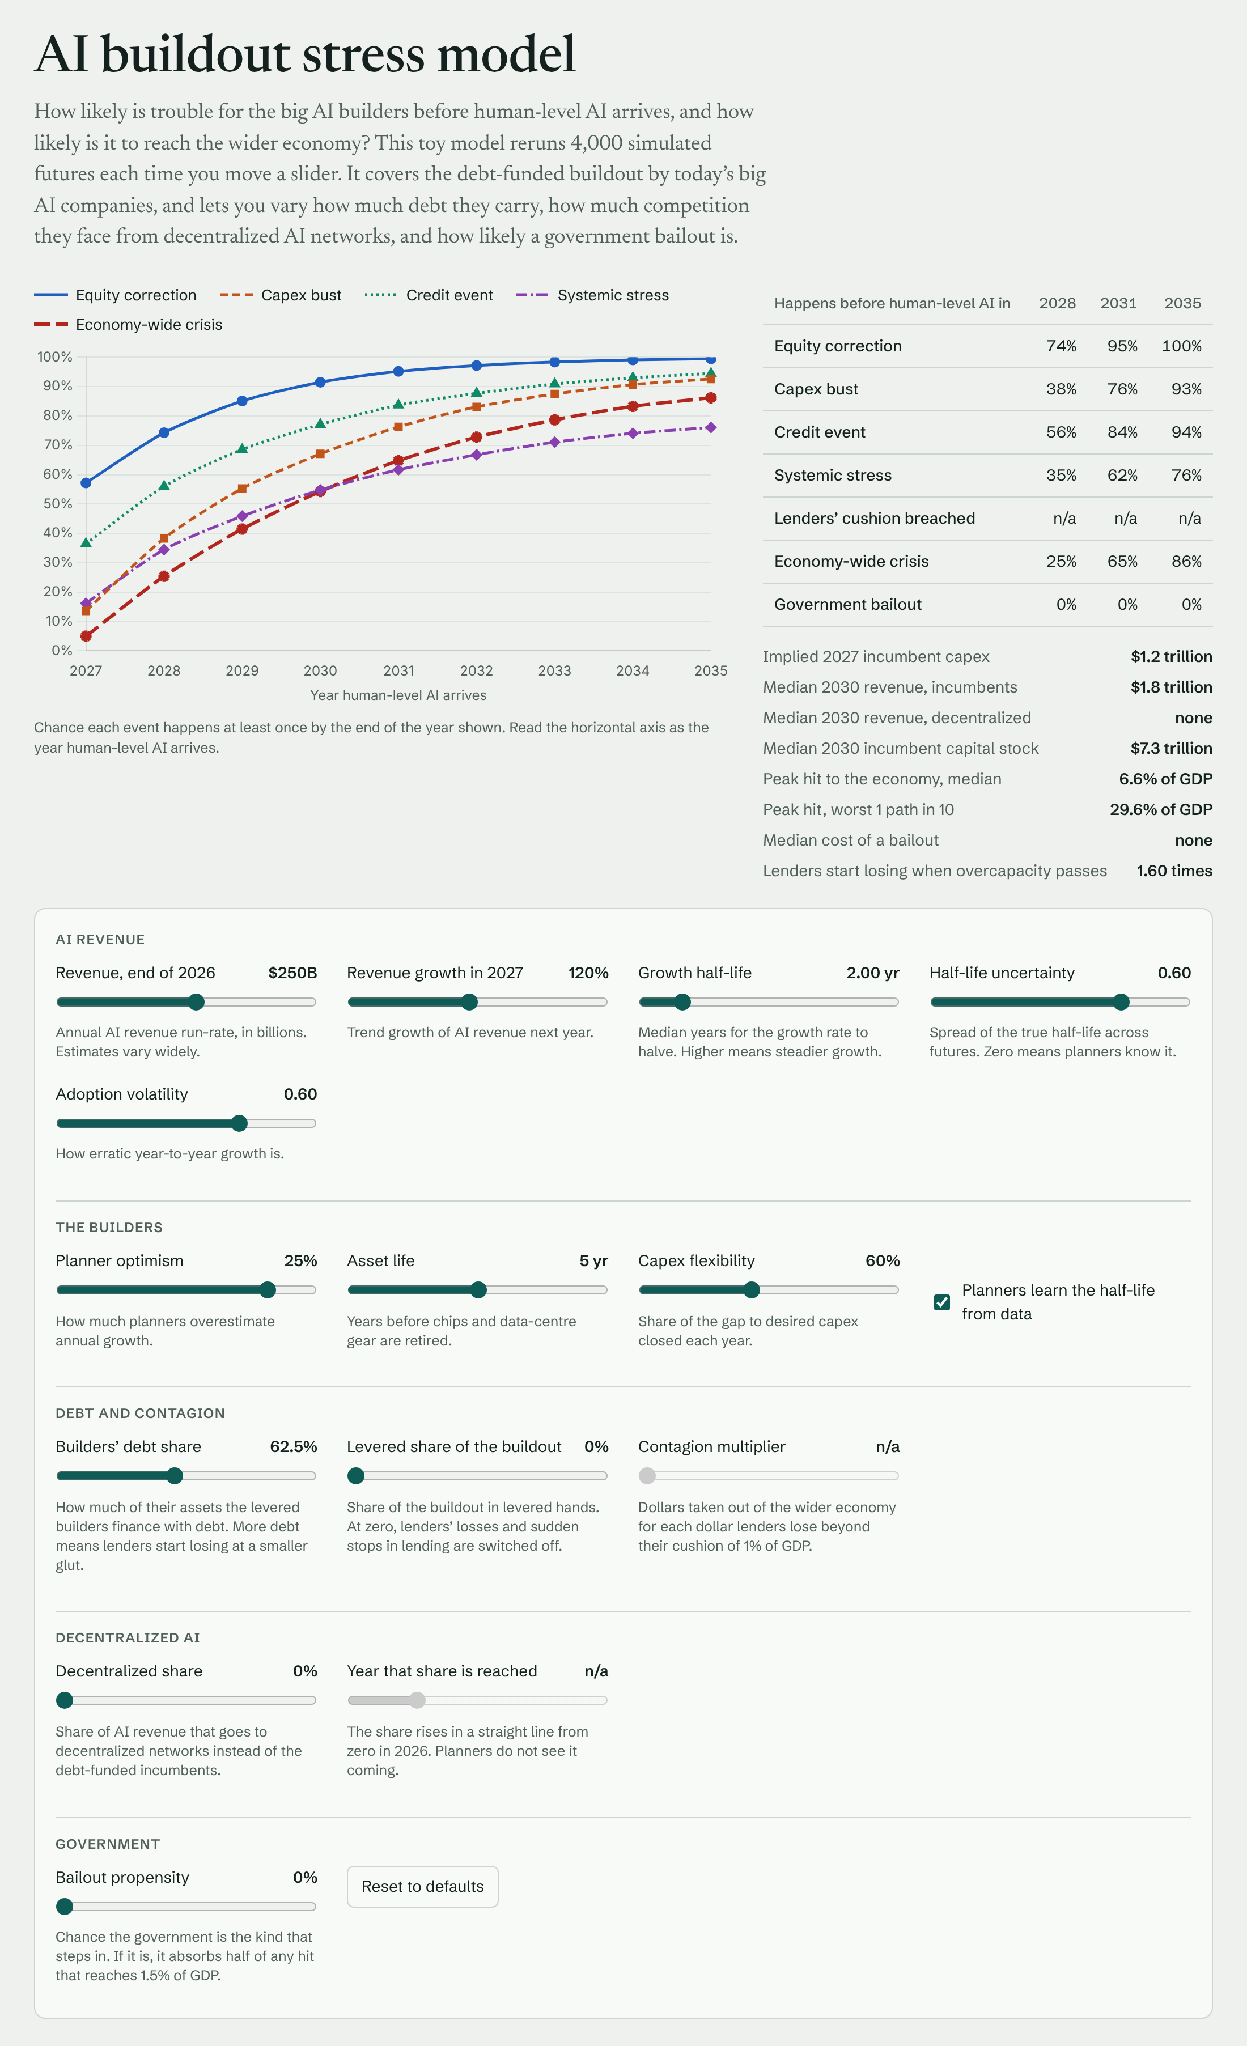
One clear finding from these first three examples and many others I played with is: The results depend far more on how optimistic and how uncertain the planners are than on the HLAGI date itself.
Example 4: The revenue numbers from my August post
The first three examples all start from the default revenue numbers. This one asks what happens if AI revenue is far weaker, as I assumed in August.
In August I assumed AI revenue of about $100 billion in 2026, doubling every 18 to 24 months. To reproduce that here I set starting revenue to $100 billion and growth to 50%, and I push the growth half-life out to 8 years so that growth stays nearly steady. Everything else stays at the default.
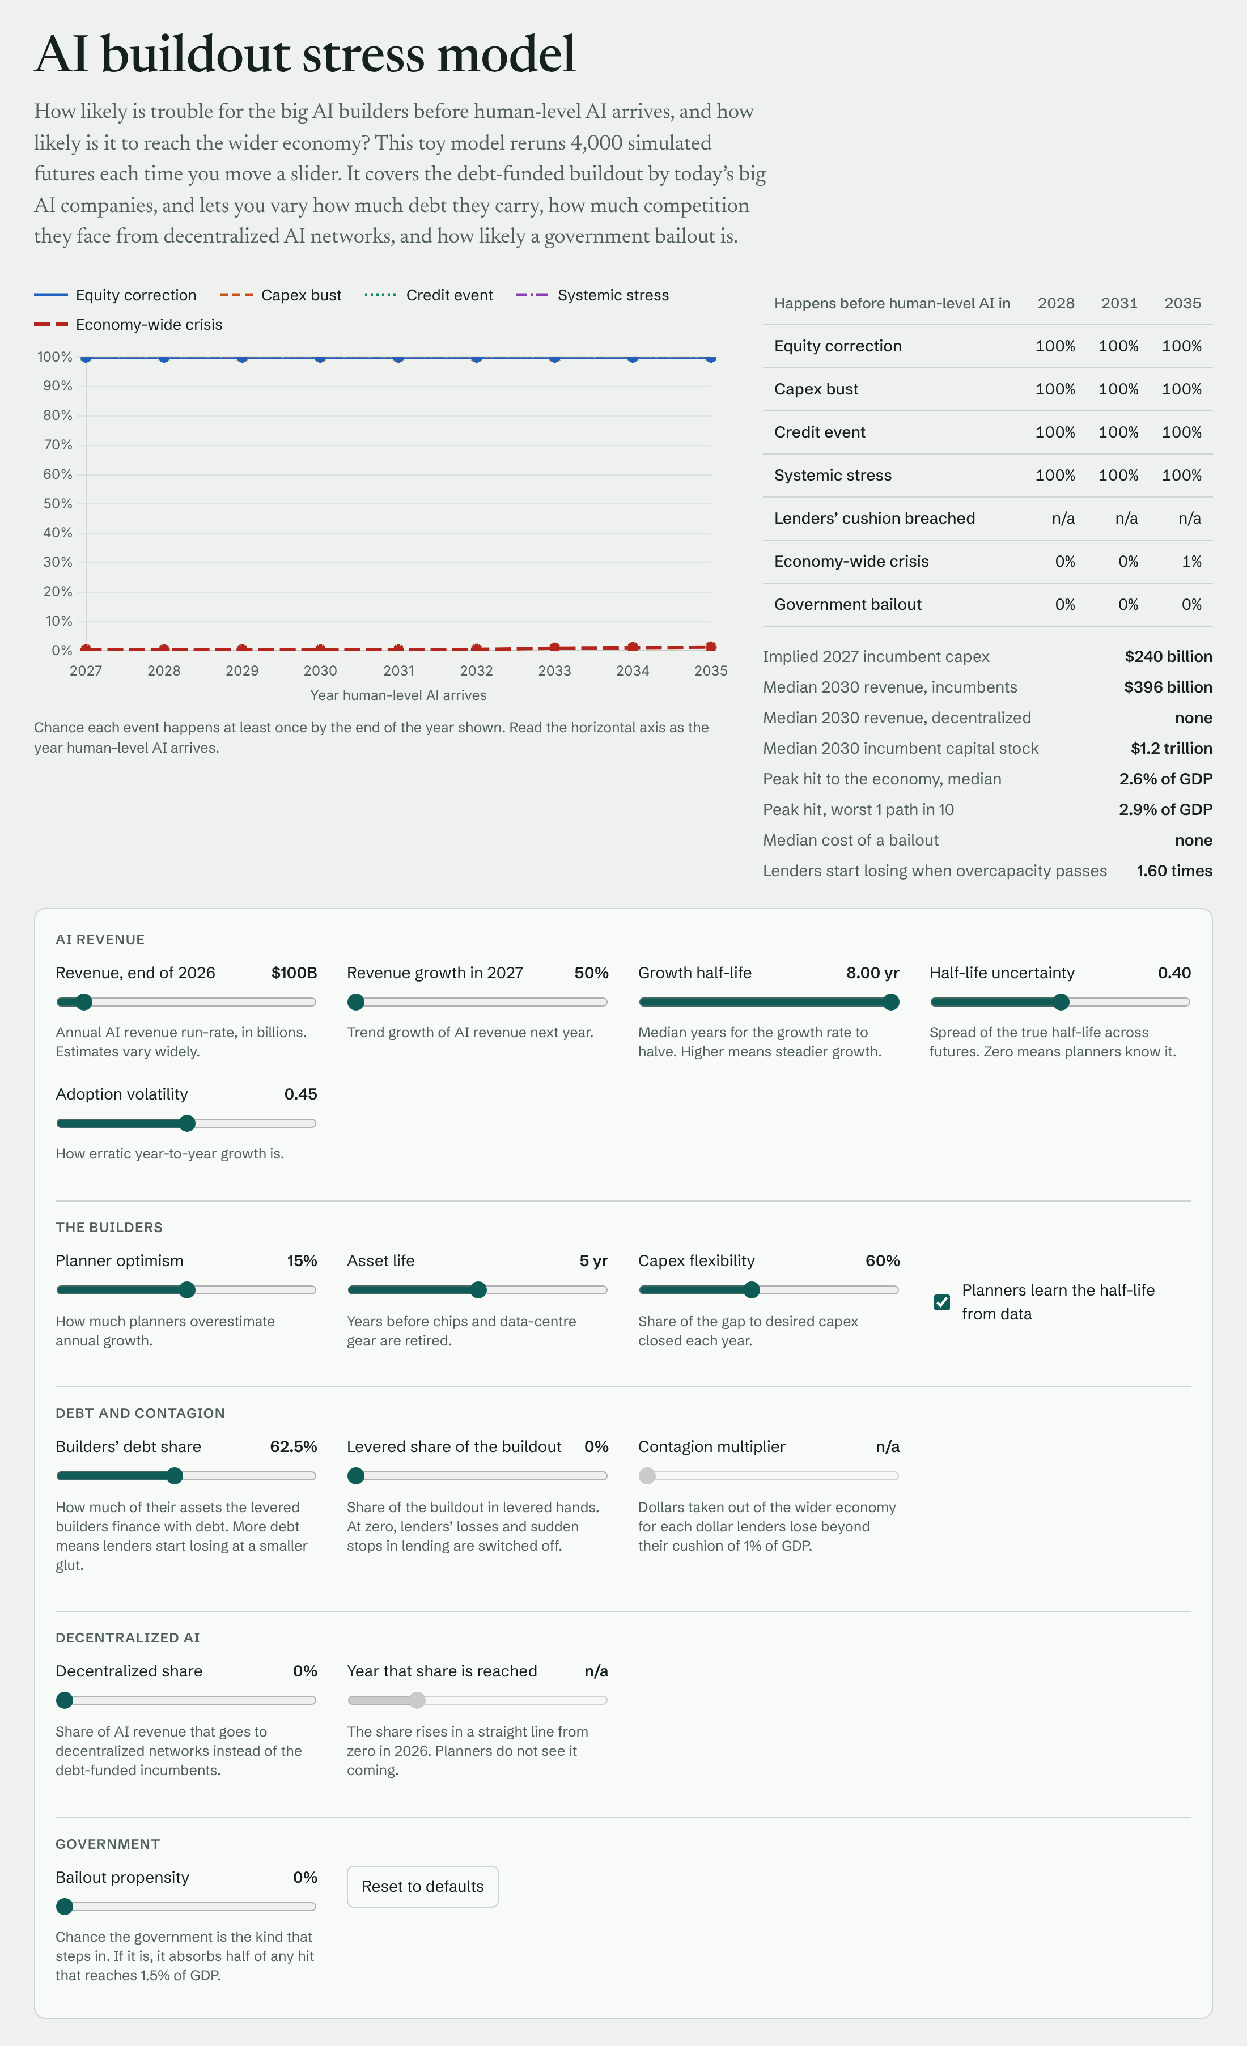
The result could not be clearer. All four kinds of trouble, systemic stress included, show up in the very first year in every one of the 4,000 simulated paths. So with my August revenue assumptions the model agrees with my August conclusion, and then some: a crash is the expected outcome whatever the HLAGI date.
But look at the fifth line. The chance of an economy-wide crisis is close to zero. With these revenue numbers the builders are in deep trouble at once, but in the model they also stop building at once, so the complex never gets big. The peak hit is about 2.6% of GDP in nearly every path, just under my 3% bar. Call it a nasty recession-sized shock, not a crisis. I would not lean hard on that distinction. It sits very close to the bar, and this example has none of the leverage and contagion that my August post was mostly about. Example 6 comes back to that.
Four observations on how this squares with the milder baseline results above:
- The difference is almost entirely the revenue curve. Both analyses start from the same pile of hardware, which costs on the order of a trillion dollars a year to carry by 2027. In August I had revenue of $300 to $500 billion a year in 2028 to 2030. The baseline here has a median of about $0.9 trillion in 2028 and $2.0 trillion in 2030.
- The data since August lean toward the higher curve. As the section on the starting point showed, the year-end run rate is more like $200 to $300 billion, and two labs alone are already past the $100 billion I assumed for the whole industry.
- The capex gap is the real disagreement. With the August numbers, planners who size their capacity to revenue would spend about $240 billion in 2027. The actual plans are around a trillion. So either the builders believe something like the baseline curve, or they are not sizing to revenue at all. The second is what I argued in August: the race between the US and China makes over-betting an equilibrium, not a forecasting error. This model only knows about forecasting errors.
- The timing differs because the model has no debt schedule. It flags stress the moment overcapacity appears. In the real world the debt comes due on a schedule, so the reckoning waits for the refinancing gates, which fell in 2028 to 2030 in the August analysis.
What about starting points between my August number and the default? Here is the model with everything else, growth included, at the defaults:
Here is the table converted into editable, copyable text, preserving the original wording and values.
| Starting revenue | Credit event by 2031 | Systemic stress by 2031 | Economy-wide crisis by 2031 |
|---|---|---|---|
| $150 billion | 60% | 23% | 14% |
| $200 billion | 52% | 17% | 22% |
| $250 billion | 49% | 17% | 31% |
| $300 billion | 48% | 17% | 40% |
Between $200 and $300 billion the builders’ own risks barely move. Below about $150 billion they climb quickly. The economy-wide risk runs the other way: more revenue today means a bigger buildout tomorrow, and a bigger buildout means a bigger hit when it stumbles. So a weak start is worse for the builders and, oddly, safer for everyone else.
Example 5: Decentralized AI takes 40% of the market by 2028
In the first four examples today’s incumbents collect all the AI revenue. This one lets someone else take a large share of it.
Here I go back to the default revenue numbers and let decentralized AI networks take 40% of AI revenue by 2028, rising in a straight line from zero today. Total AI revenue is the same as in the baseline. The incumbents’ planners don’t see it coming. They find out one year at a time, from their own revenue.
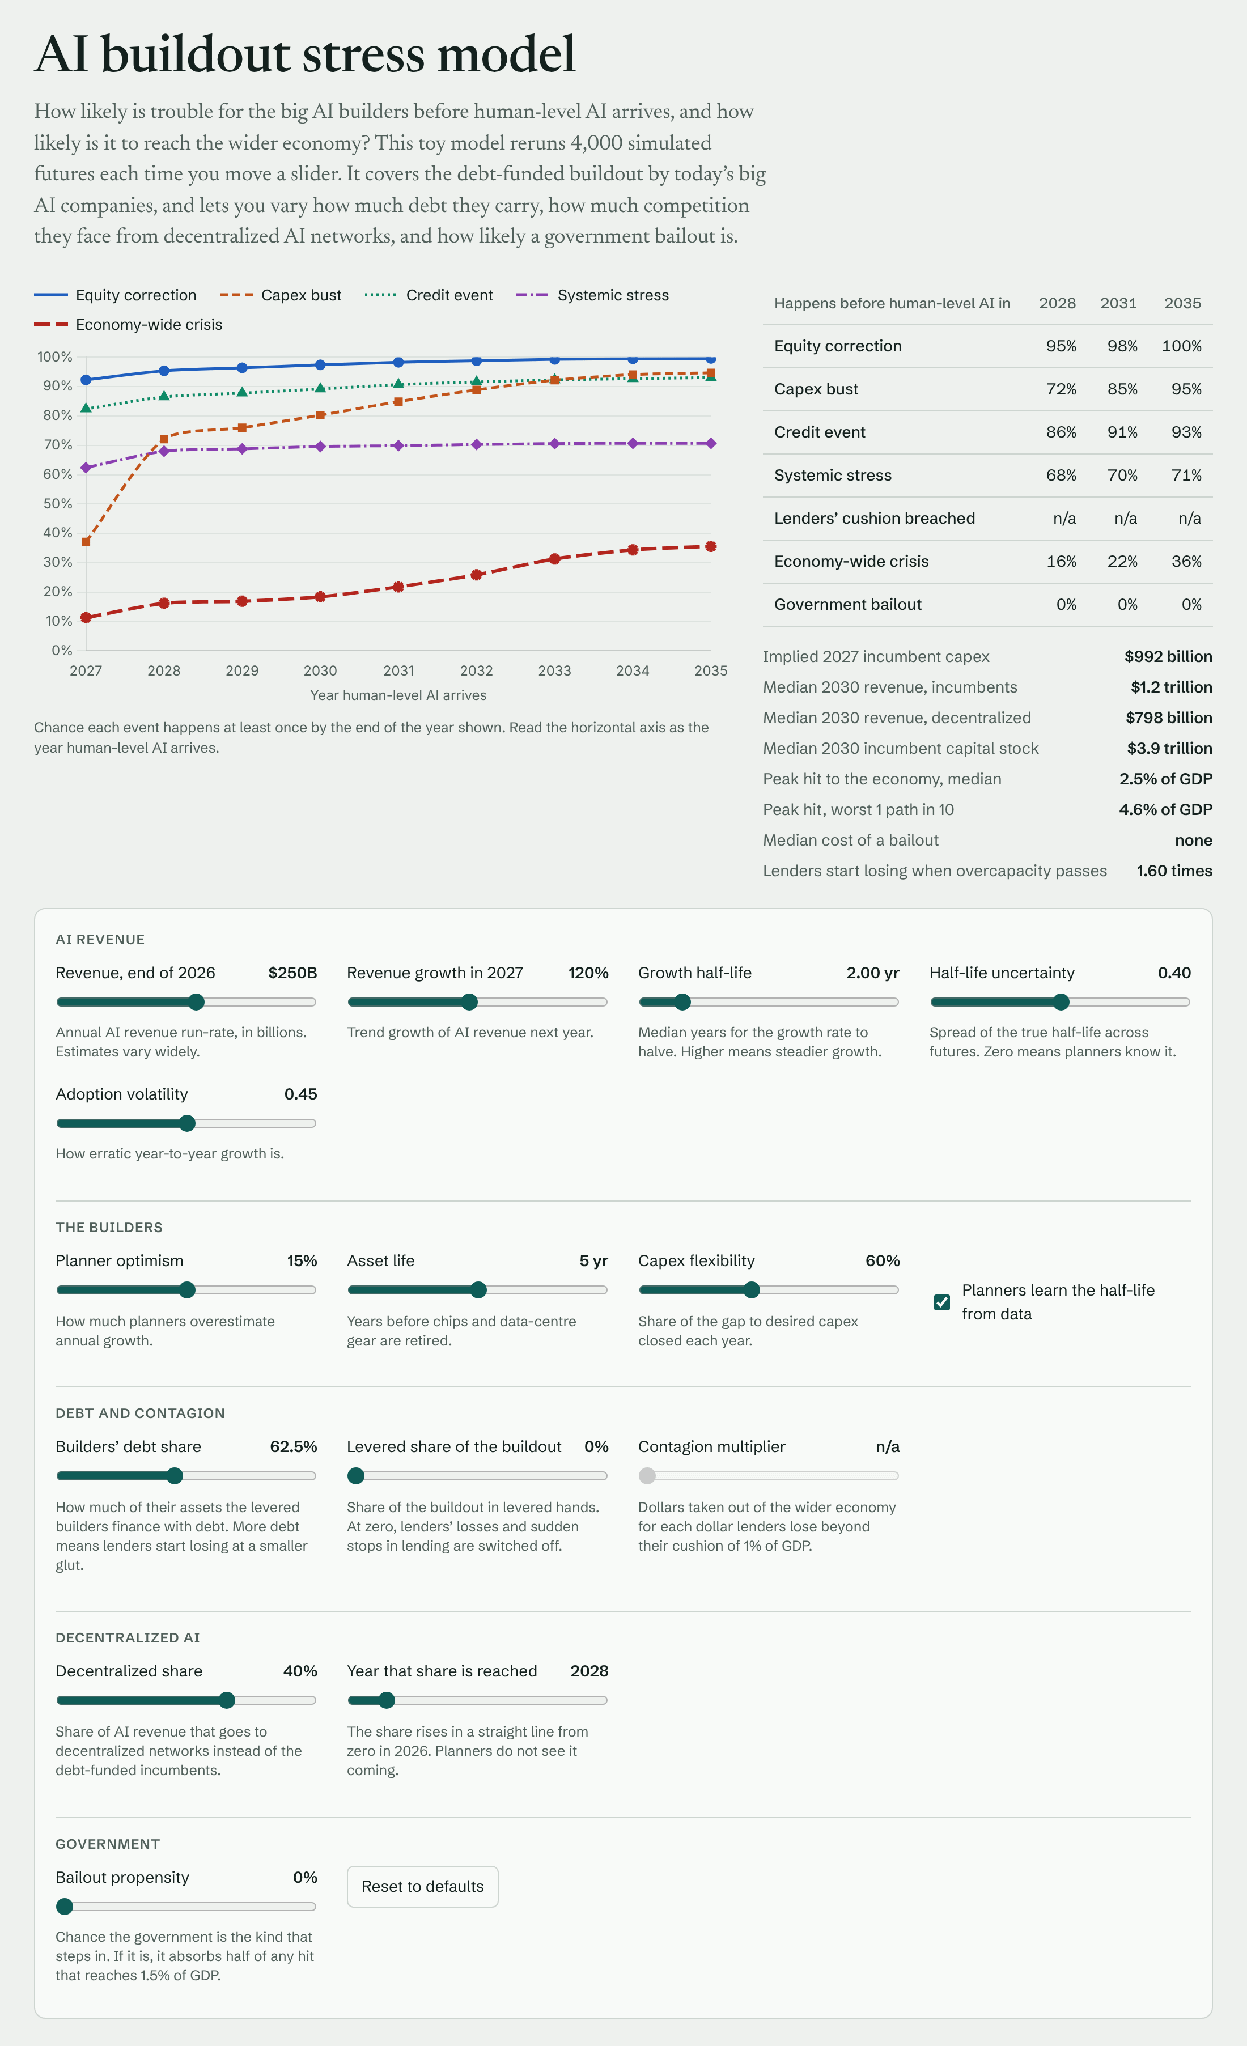
For the incumbents this is worse than exuberant planning. If HLAGI arrives in 2028, a credit event has an 86% chance and systemic stress 68%, against 25% and 8% in the baseline. Most of the damage lands in the first two years, while market share is being lost and the hardware bought for a bigger market is still on the books.
For the economy as a whole the picture is different, and more interesting. The chance of an economy-wide crisis is 16% if HLAGI arrives in 2028, against 5% in the baseline. But for 2031 it is 22% against 31%, and for 2035 it is 36% against 51%. So decentralized success raises the danger to the wider economy during the transition, while the incumbents slam the brakes on spending, and lowers it afterwards.
Some observations here too:
- This is the incumbents’ half of my August argument, in numbers. In August I wrote that with a decentralized network in the lead, the deposit arrives and clears into someone else’s account: the technology wins and the levered claims on it do not. Here the median incumbent revenue in 2030 is $1.2 trillion instead of $2.0 trillion, and about $0.8 trillion a year flows through the networks.
- The model now sees a little of the other half. The first four kinds of trouble are measured on the debt-funded side, and the networks carry no debt, so they cannot default. The economy-wide measure adds one thing: the networks can put the incumbents’ stranded hardware to work, up to half of the capacity their own revenue supports. That is part of why the hit to the wider economy is smaller than the incumbents’ distress would suggest.
- It shrinks what can blow up. Once the planners catch on, they build less. The incumbents’ median capital stock in 2030 is $3.9 trillion in this case, against $6.4 trillion in the baseline. A smaller levered structure means smaller losses when it cracks, even though cracks are more likely. That is the main reason the economy-wide risk ends up below the baseline from about 2030 on.
- Speed is what hurts. If the same 40% share arrives in 2030 instead of 2028, systemic stress by 2028 drops from 68% to 39%. A 20% share by 2028 gives 27%. A slow or well-anticipated loss of share is far less destructive than a fast surprise. The same holds for the wider economy: with the share arriving in 2030, the crisis odds for 2028 are 10% instead of 16%.
- The result leans on the hardware being reusable. If the networks could not use any of the incumbents’ stranded hardware, the economy-wide crisis odds would be 32%, 40% and 53% for 2028, 2031 and 2035. That is worse than the baseline until the early 2030s, and no better after. If they could use twice as much as I assumed, the odds would be 7%, 11% and 26%. This is the assumption most favourable to the decentralized case, and I have an obvious stake in it, so weigh it accordingly.
- It refines what I said in August. I suggested then that decentralized AGI might be the one factor that keeps the crash from happening. For Big Tech the model says the opposite: decentralized success makes the incumbents’ crisis more likely. For the economy as a whole it says something closer to my August claim, with a delay. There is more risk for the first couple of years and less after that, because the part of the economy that is levered to the bet is smaller. What is still not modelled would push further in that direction: capital shifting from debt to pay-as-you-go funding before the hardware gets bought, and a spending race that deflates because nobody can win it by outspending the others.
Example 6: Leverage and contagion switched on
The examples so far say nothing about who lent the money. My August post was mostly about that: how much of the bet is made with debt, and what happens to the lenders. This example switches those dials on.
I go back to the default revenue numbers and the default planners. The levered builders now finance 75% of their assets with debt, 45% of the buildout is in their hands, and the contagion multiplier is 2. Together those put debt at about a third of the whole buildout, which is roughly what recent reporting suggests.
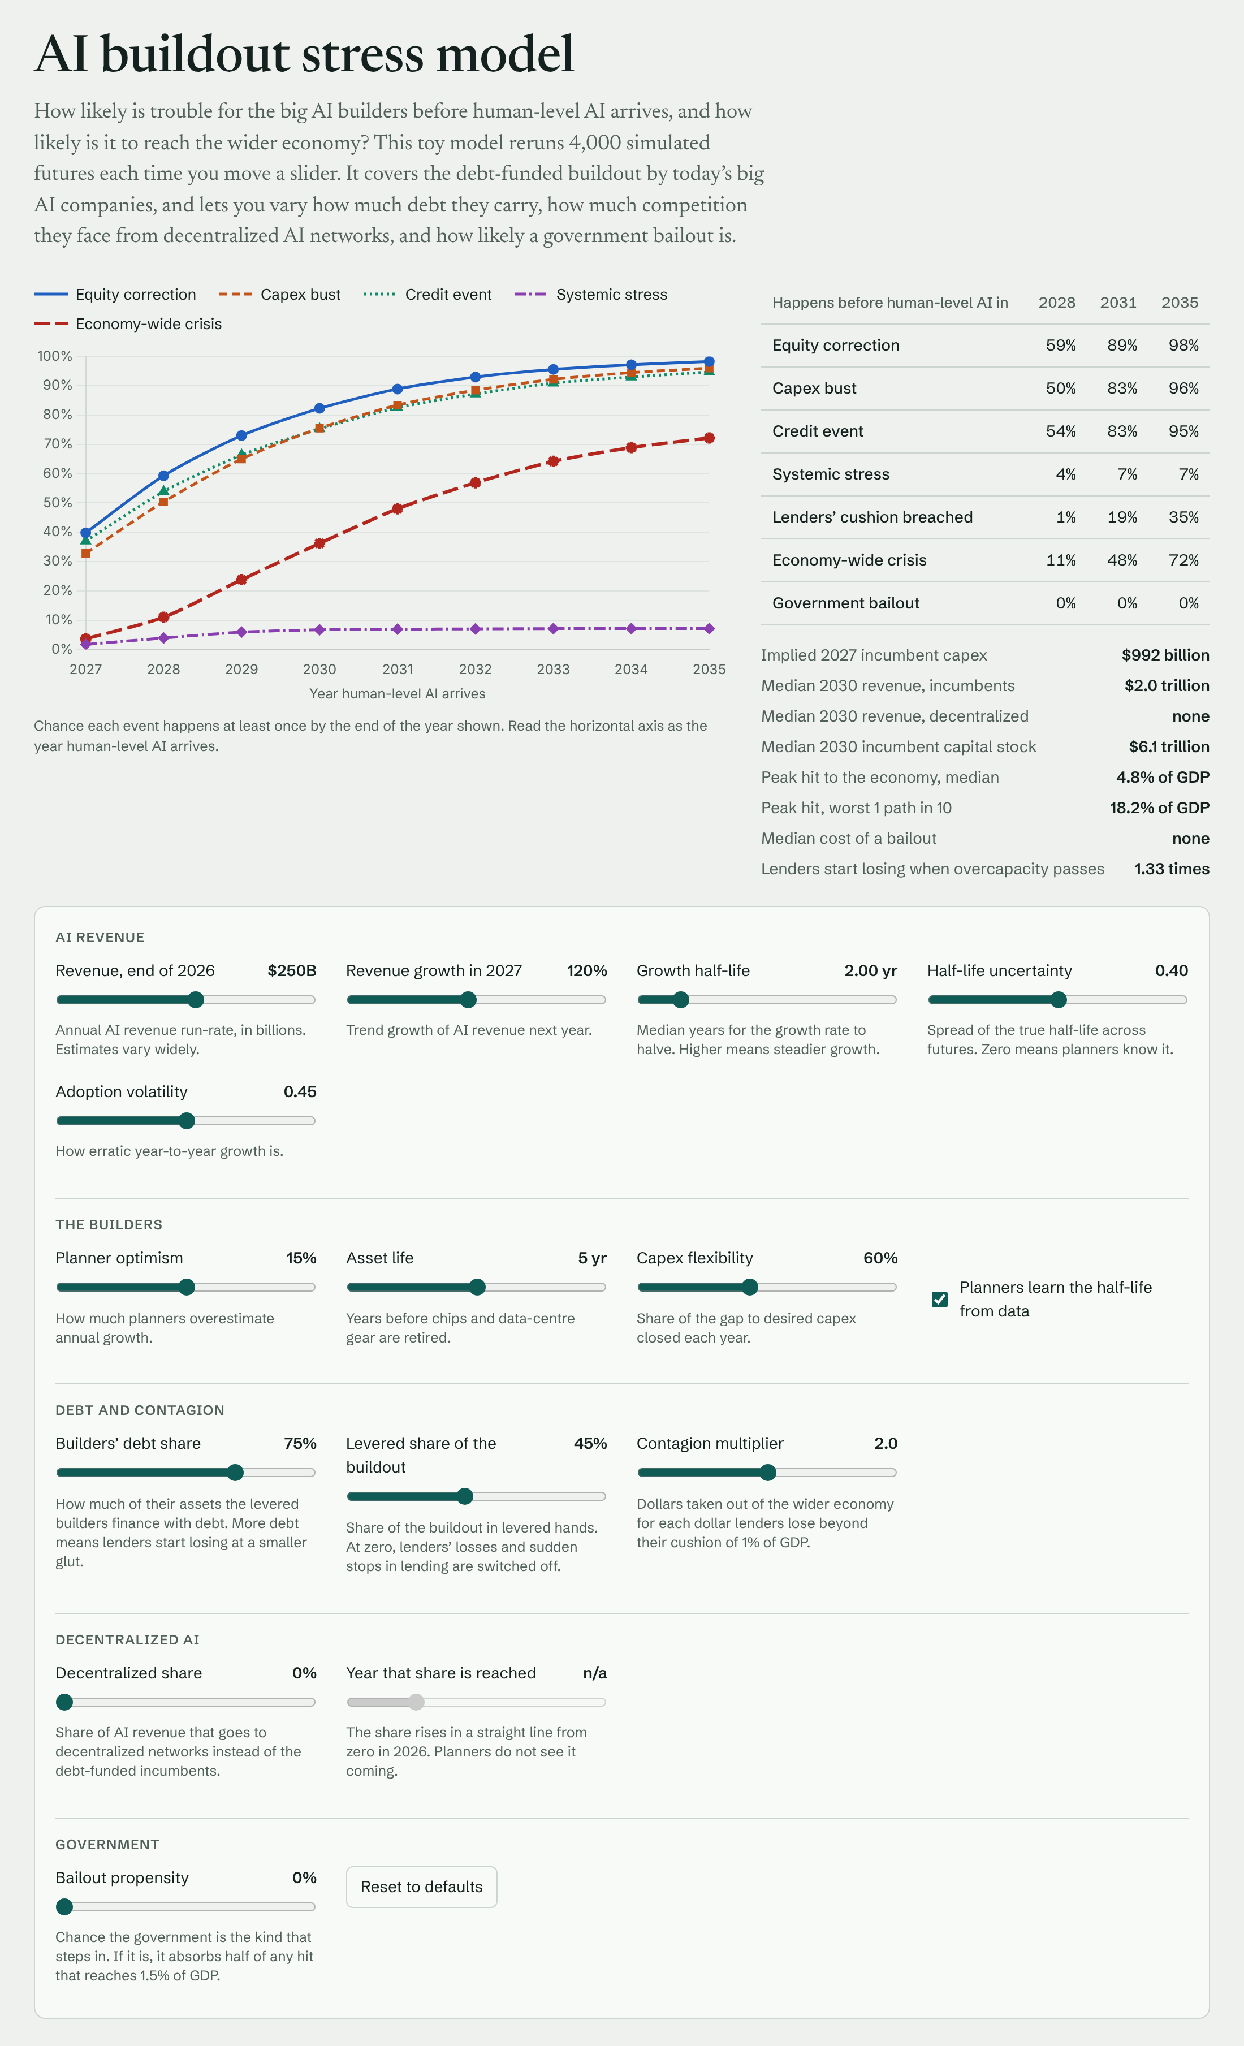
With 75% debt, lenders start losing once overcapacity passes 1.33 instead of 1.6. Credit events become much more likely: 54% if HLAGI arrives in 2028 and 83% for 2031, against 25% and 49% in the baseline. Capex busts become more likely too, at 50% and 83%, because a credit event now cuts off the borrowed part of next year’s spending. For the wider economy the chance of a crisis rises to 11% for 2028, 48% for 2031 and 72% for 2035, against 5%, 31% and 51%.
Some observations:
- The lenders’ cushion mostly holds, but not always. Lenders’ losses exceed 1% of GDP in 1% of paths by 2028, 19% by 2031 and 35% by 2035. Those are the futures where a problem for AI lenders becomes a problem for everybody’s credit.
- The contagion dial changes how bad the worst cases are, not how often a crisis happens. With the multiplier at 0, 2 or 4 the crisis odds are the same. The hit in the worst tenth of paths goes from 16% of GDP to 18% to 20%. By the time the lenders’ cushion gives way, the hit is usually past my 3% bar already.
- The old systemic-stress line falls, and that is misleading. It drops from 17% to 7% for 2031, because sudden stops in lending keep the glut from getting as deep. Once debt is switched on, the lenders’ cushion row is the better guide to financial stress.
- Disciplined planners make the same debt nearly harmless. With the careful planners of Example 2 and these same debt dials, credit events reach 21% by 2031, the lenders’ cushion is never breached, and the crisis odds are 8%. Debt does not create the mistake. It decides how hard the mistake lands.
- A decentralized takeover of heavily indebted incumbents is the roughest handover. With these debt dials and the decentralized share of Example 5, the crisis odds for 2028 are 36%, against 16% in Example 5 and 11% here. The more the incumbents have borrowed when the networks arrive, the harder the transition.
- My August numbers plus this much debt sit right at the crisis bar. In Example 4 the peak hit was about 2.6% of GDP, just under my 3% bar. With these debt dials it is about 3.0%, and the crisis odds jump from near zero to about 50%. I read that as a hit about 15% larger that happens to straddle the bar, not as a different kind of outcome.
Example 7: The same buildout with less debt
What if the builders borrowed less? The dials are the same as in Example 6, except that the levered builders finance 50% of their assets with debt, not 75%.
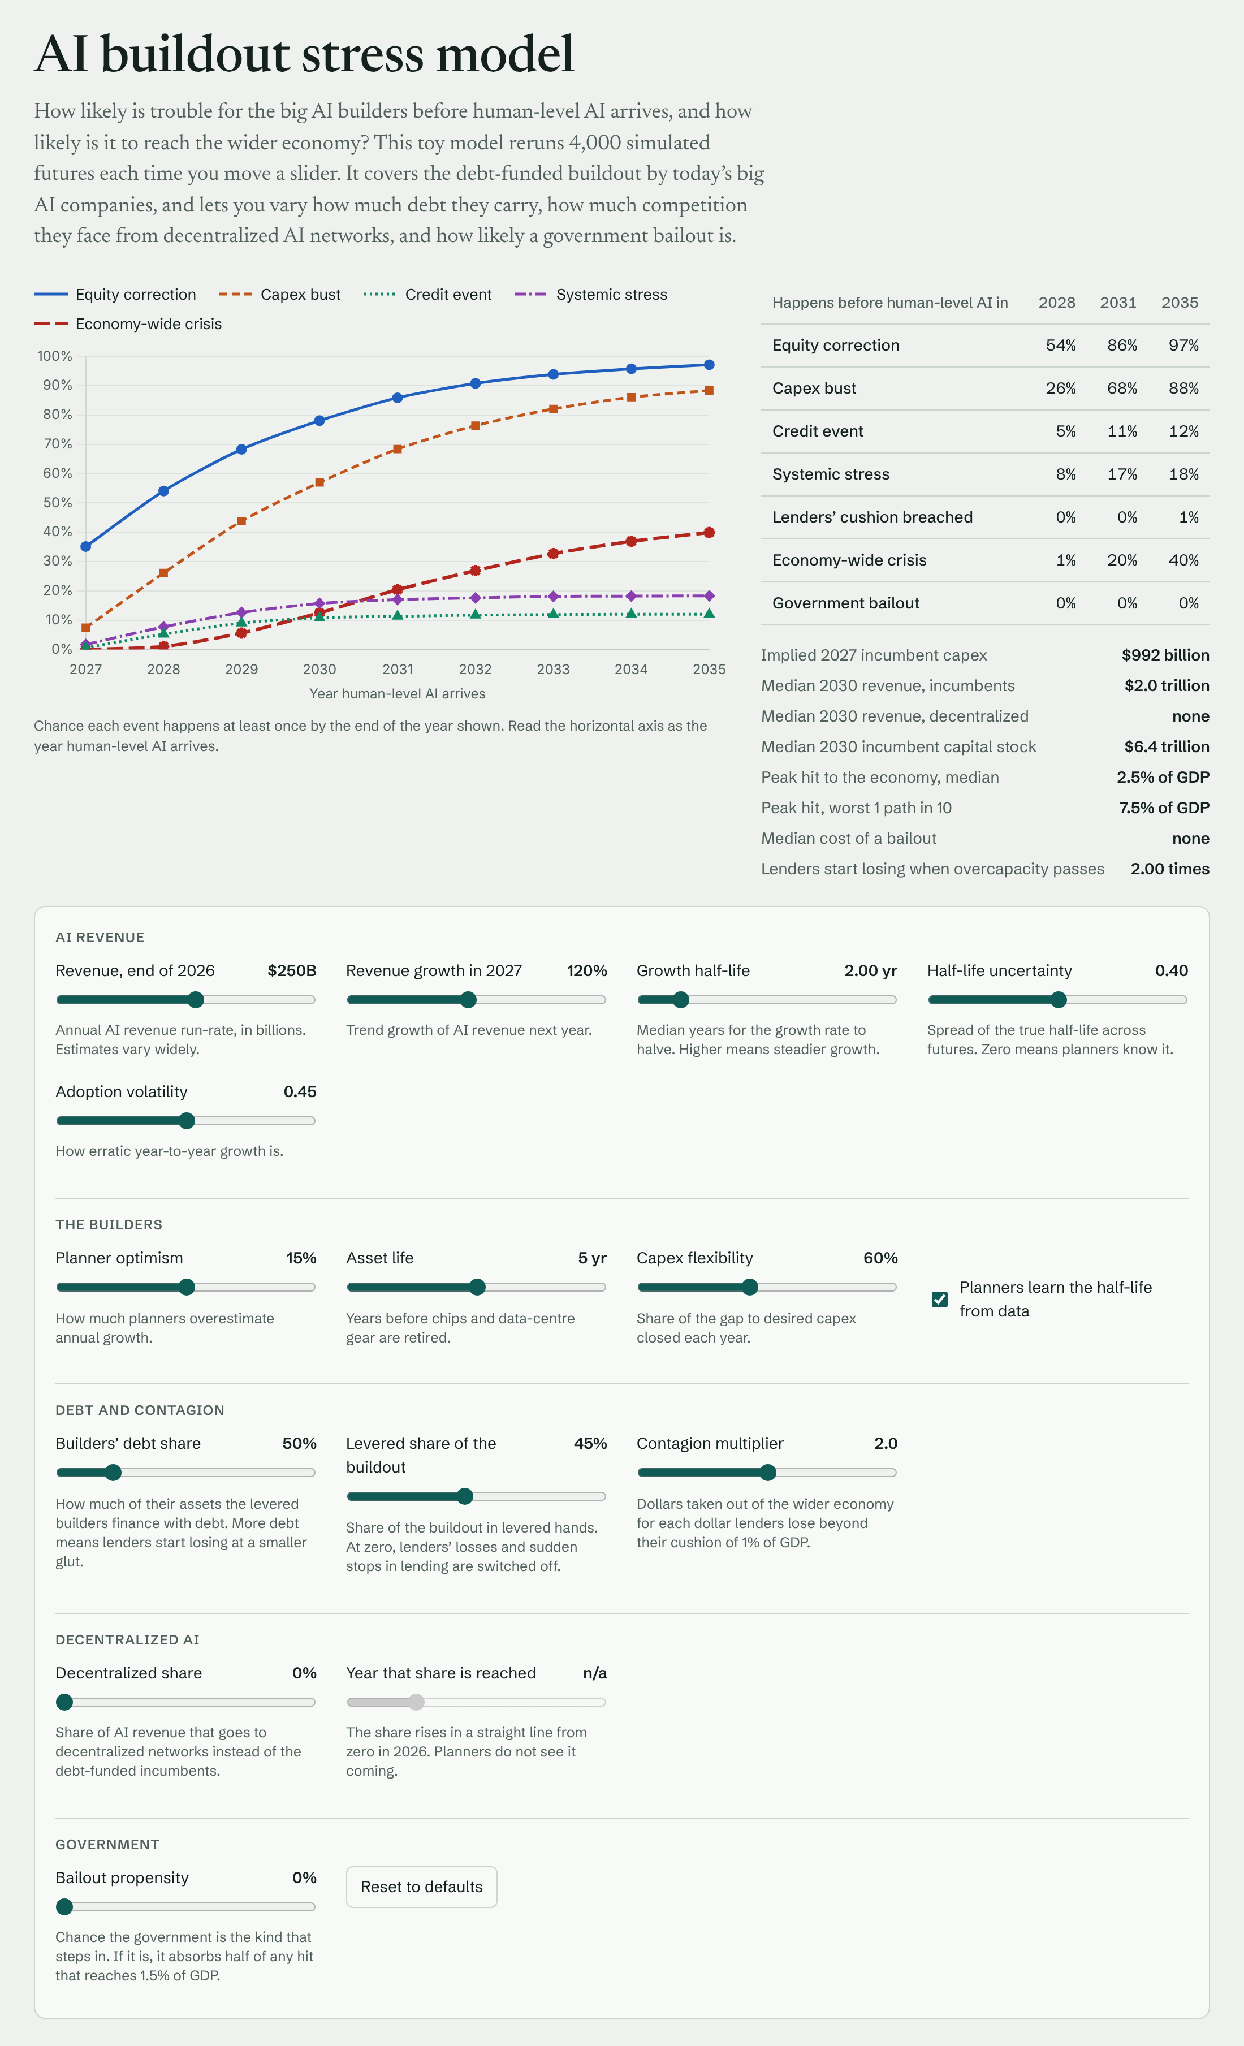
Now lenders only start losing when overcapacity passes 2.0, which is rare. Credit events fall to 5% if HLAGI arrives in 2028 and 11% for 2031, and the lenders’ cushion is almost never breached. The chance of an economy-wide crisis is 1% for 2028, 20% for 2031 and 40% for 2035. That is lower than in the baseline, because capital that merely earns a poor return is not stranded as long as nobody defaults on it.
Some observations:
- Capex busts are untouched, at 26%, 68% and 88%. Less debt does not make the builders better forecasters. It only changes who gets hurt when they are wrong.
- This is the fractional-Kelly point from my August post, in numbers. The bet is the same size and has the same odds. Sizing the borrowed part down from 75% to 50% takes the chance of a credit event by 2031 from 83% to 11%.
- What remains is the spending-cut channel. Even with safe lenders, a buildout that is several percent of GDP can still stall, which is why the crisis odds do not go to zero.
Example 8: Full Kelly
Now put the two dangerous dials together: the exuberant planners of Example 3 with the heavy debt of Example 6. This is the closest the model comes to what I called Full Kelly in August: an over-confident bet, made largely with borrowed money.
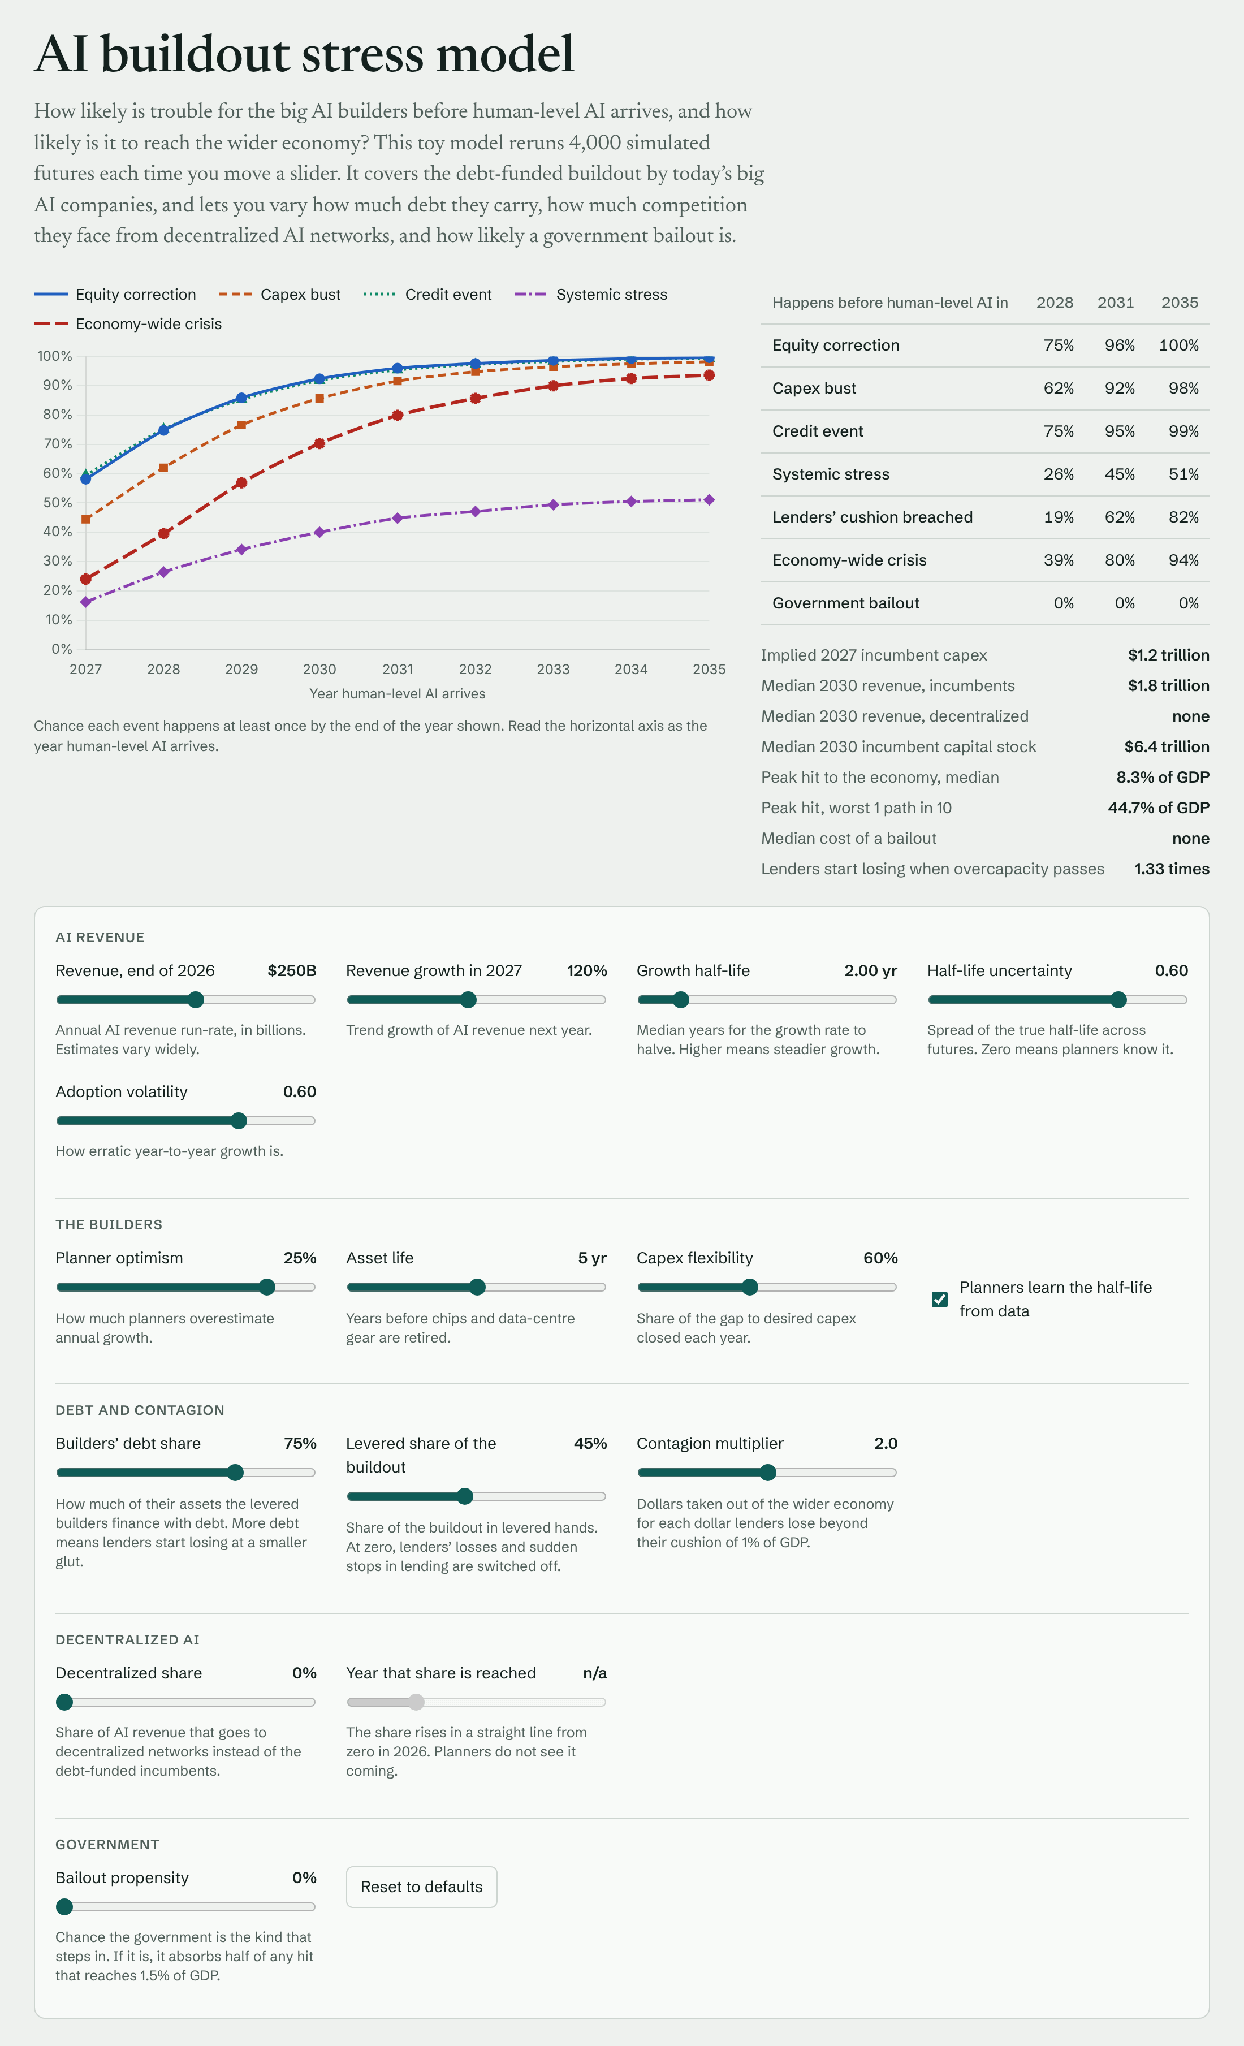
Everything gets worse at once. Credit events reach 75% if HLAGI arrives in 2028 and 95% for 2031. The lenders’ cushion is breached in 19% of paths by 2028, 62% by 2031 and 82% by 2035. The chance of an economy-wide crisis is 39%, 80% and 94%.
Some observations:
- Optimism and debt compound. Exuberance alone, in Example 3, gives crisis odds of 65% for 2031. Heavy debt alone, in Example 6, gives 48%. Together they give 80%, and the lenders’ cushion is breached three times as often as with heavy debt alone.
- The worst cases get very large. In the worst tenth of paths the hit is about 45% of GDP in a single year. I would not take that number literally, because the model has none of the brakes a real economy has. What it does say is that this corner of the dials is where the truly bad outcomes live.
- This is the scenario to worry about, and nobody can rule it out. We cannot observe how optimistic today’s plans are, and the borrowing has been growing fast.
Example 9: The government steps in
So far there has been no rescue. Now suppose the government is certain to step in. I assume a simple and fairly generous kind of bailout. Whenever the hit to the economy reaches 1.5% of GDP in a year, the government absorbs half of it, by buying or guaranteeing distressed debt and by becoming a customer of last resort for compute. The other half still lands on the economy. Here is the baseline with the bailout propensity at 100%.
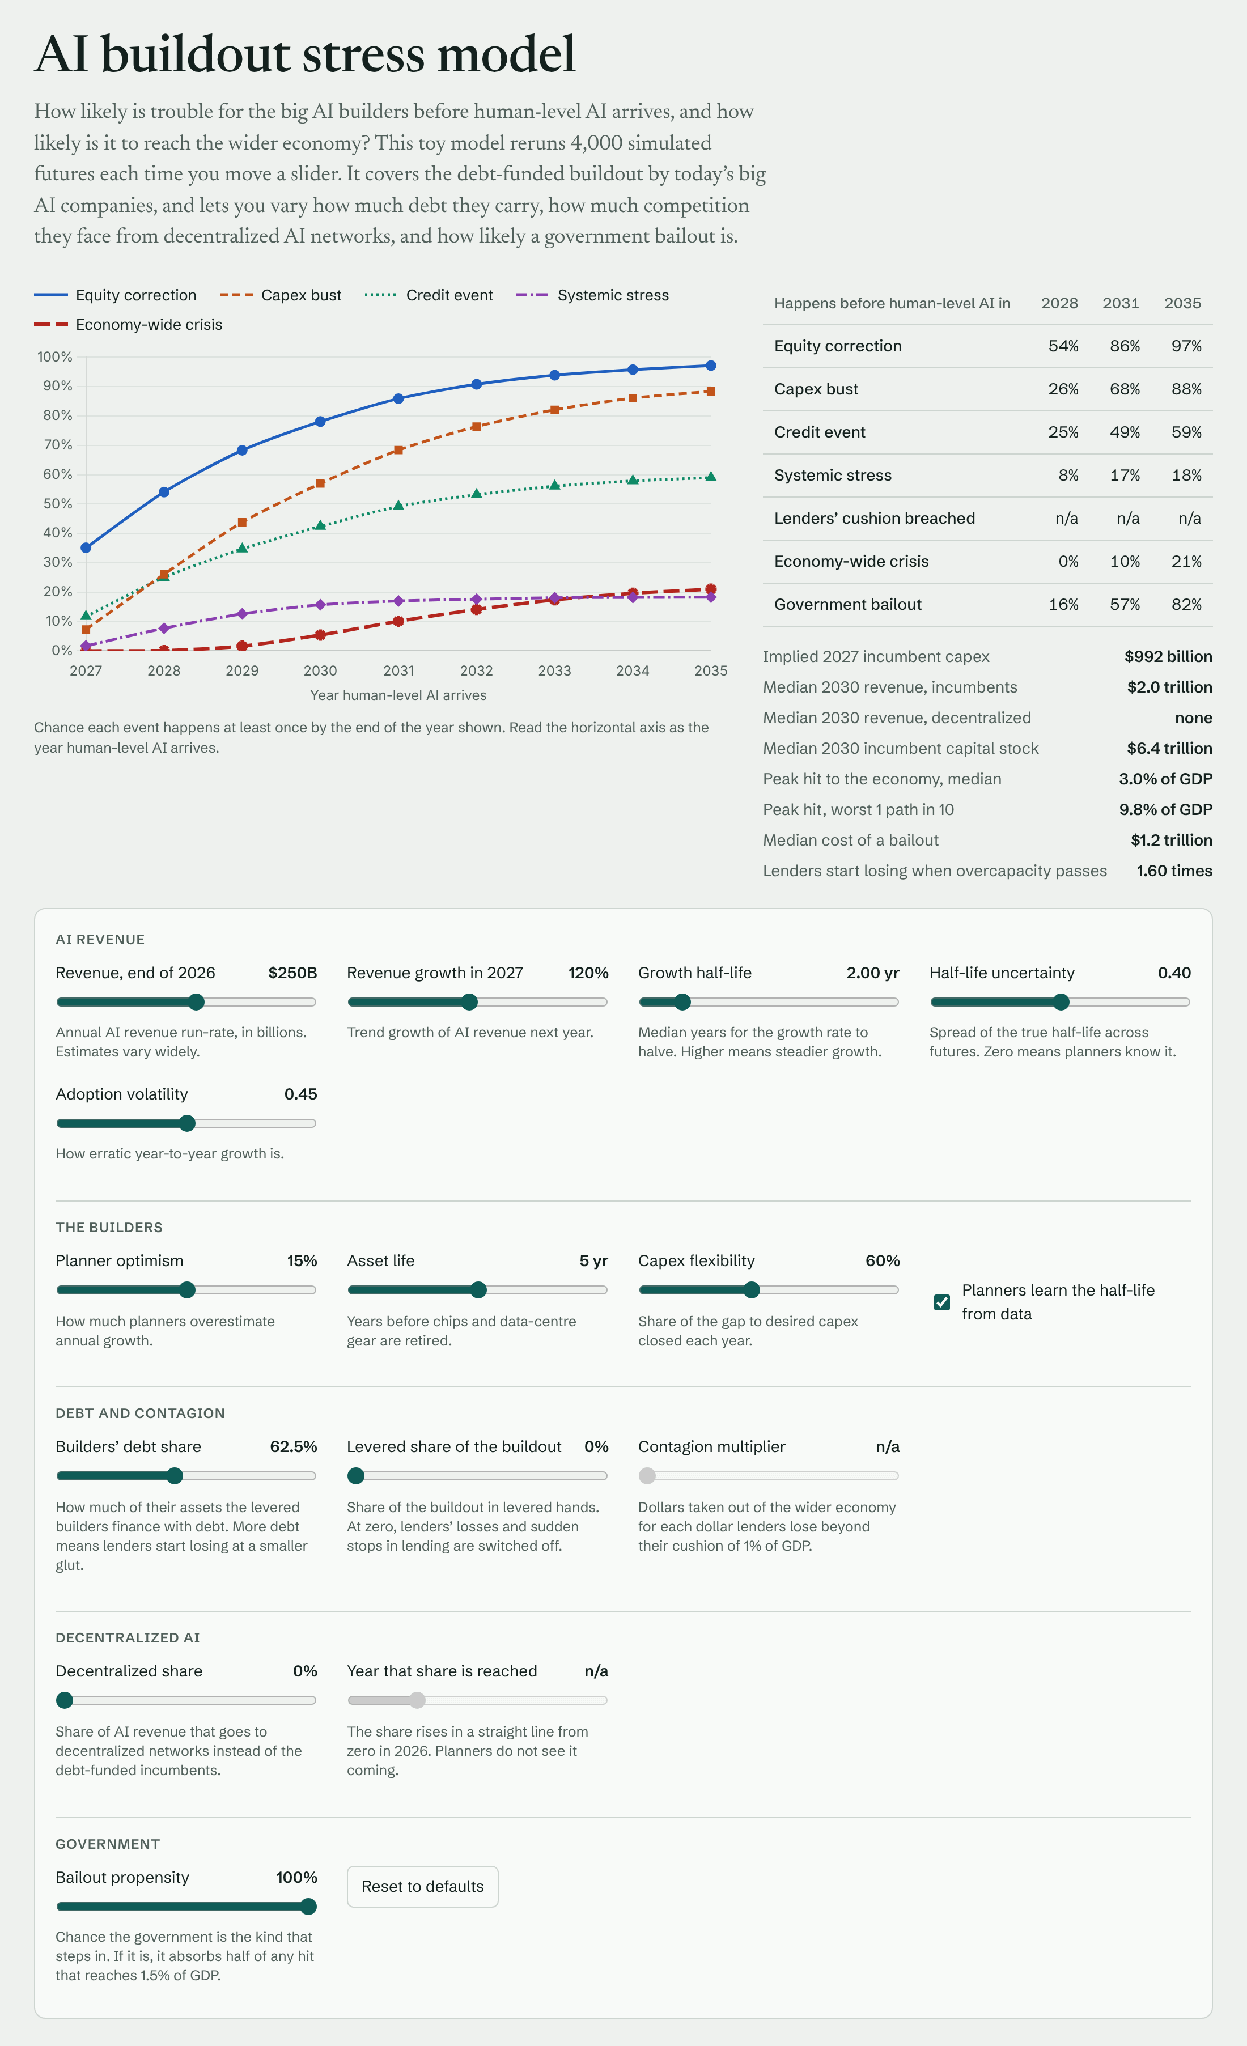
Nothing changes inside Big Tech: the first four lines are the same as in the baseline. What changes is the fifth. The chance of an economy-wide crisis falls from 31% to 10% for HLAGI in 2031, and from 51% to 21% for 2035. The price is that a bailout happens in most futures, 57% by 2031 and 82% by 2035, at a median cost of about $1.2 trillion.
Here is the same dial applied to the other cases. The figures are the chance of an economy-wide crisis if HLAGI arrives in 2031.
Here is the table converted into editable, copyable text, preserving the original wording and values.
| Scenario | No bailout | 50% propensity | Certain bailout | Median cost of a bailout |
|---|---|---|---|---|
| Baseline | 31% | 20% | 10% | $1.2 trillion |
| Exuberant planners | 65% | 49% | 32% | $2.6 trillion |
| August numbers (Example 4) | 0% | 0% | 0% | $0.5 trillion |
| Decentralized AI (Example 5) | 22% | 12% | 1% | $0.7 trillion |
| Leverage switched on (Example 6) | 48% | 34% | 20% | $1.9 trillion |
| Full Kelly (Example 8) | 80% | 60% | 40% | $3.8 trillion |
A few observations:
- A bailout works best where the hits are modest. In the decentralized case a certain bailout takes the crisis odds from 22% to 1%, because most of the hits there are only a little above the bar. With exuberant planners it leaves them at 32%, because half of a very large hit is still large.
- It moves the cost. It does not remove it. The median bailout is over a trillion dollars in the baseline and $2.6 trillion with exuberant planners. As I argued in August, a bill like that most likely gets paid through inflation and financial repression, which spreads it across everyone.
- A bailout that breeds exuberance can cancel itself out. In the model a bailout changes nothing inside the AI companies. In reality a credible promise of rescue is a reason to plan more optimistically and borrow more. With the exuberant settings, even a certain bailout leaves the 2031 crisis odds at 32%, about where the baseline stands with no bailout at all.
- Debt makes the bailout bigger and less effective. With leverage switched on, a certain bailout still leaves the 2031 crisis odds at 20%, and its median cost rises from $1.2 trillion to $1.9 trillion. In the Full Kelly case it leaves them at 40%, at a median cost of $3.8 trillion.
- In the August case the bailout is close to pointless. It is triggered in nearly every path, and costs about half a trillion dollars, to soften a shock that was already just under the crisis bar.

What the examples add up to
The biggest TL;DR from these simulations is a not super surprising one: On a path that leads to HLAGI by 2035, the model predicts painful shakeouts but not the kind of massive collapse that the strongest bubble claims predict. One sees claims from bubble-alarmists that the revenue is illusory, the infrastructure will be stranded, and the unwinding will look like 2000 or 2008. Under the given assumptions, though, four features of the model work against this kind of calamity occurring.
To understand why, look at the figures below, drawn from the baseline settings:
- The revenue is real in every path. Even in the worst 5% of simulated futures, AI revenue reaches about $0.9 trillion a year by 2030, more than three times today’s level. The median is $2.0 trillion. A classic bubble prices assets with no cash flow behind them. Here the error is instead about when the cash arrives.
- Overcapacity is bounded. In the median path, the worst year has 1.7 times the capacity that revenue can support. In 99% of paths it never exceeds 2.6 times. That is a glut, but not a stranded industry.
- Gluts clear themselves. Revenue keeps growing into the excess, and five-year-old hardware drops out of the stock. In about half of the paths with credit stress, it lasts two years or less in total. This is the main difference from the fiber glut after 2000, where the assets lasted for decades.
- Spending comes back. Median capex is about $1.8 trillion in 2031 and $2.4 trillion in 2036, against $1.0 trillion in 2027. In roughly three quarters of paths, capex is higher in 2036 than in 2027.
The arrival of HLAGI also ends the exposure, according to the setup of the model. By assumption, adoption then accelerates and spare capacity becomes a shortage.
This should be fairly economically comforting for those of us who think AGI is most probably near. However, a few serious caveats keep this from being an extremely comfortable conclusion.
- The interim can still be brutal. Equity corrections and capex busts are the likely outcome if HLAGI arrives after 2030. The cuts can be deep: in the median path, annual capex falls by about two thirds from its peak at some point in the decade. That is a crisis for chip and data-centre suppliers even if it is temporary. The model has no floor on spending, so it probably overstates the depth.
- For the wider economy, size matters more than solvency. By the early 2030s the buildout in the model is several percent of GDP, so even a temporary spending cut is a big event for everyone else. The chance of a crisis-sized hit to the economy is 5% if HLAGI arrives in 2028, but 31% for 2031 and 51% for 2035. Most of that comes from the spending cuts, which this model probably exaggerates. With stickier spending plans (capex flexibility at 30%) the last two figures drop to 8% and 22%.
- Optimism is the dangerous parameter. With exuberant planners, systemic stress rises from 18% to 76% by 2035. Nobody can currently know how overoptimistic today’s plans really are!
- Debt is the other dangerous parameter. With the builders 75% debt-funded, credit events by 2031 go from 49% to 83%, and the chance of an economy-wide crisis from 31% to 48%. With 50% debt they fall to 11% and 20%. Heavy debt together with exuberant planning takes the crisis odds for 2031 to 80%.
- Part of the result is the premise. I assumed revenue never shrinks, because capabilities keep advancing. If that is wrong, this particular toy model has nothing to say. One would need a different model to cover the case where AI development itself bogs down over a number of years.
- The model leaves out potential huge shocks—like, oh say, WW3… or a huge global cyber-security apocalypse. Because the goal here was to understand the consequences of Big Tech financial decisions under “normal circumstances”—aside from the somewhat historically abnormal assumption of relatively near-term HLAGI.
All in all, at the baseline settings this simple mathematical model supports at worst a moderate version of the bubble thesis: a shakeout that hurts suppliers, shareholders, and leveraged lenders. It totally does not support scenarios where the whole enterprise goes into some sort of very dire collapse before eventually being saved by the emergence of HLAGI. What the wider economy has to absorb while that shakeout plays out is a separate question, and the answer gets worse the longer HLAGI takes.
That verdict is for the baseline, though. Examples 4 to 9 showed four things that move it: a weaker starting point, competition from decentralized AI, the amount of debt, and a government bailout. With exuberant planners and heavy debt together, the model does produce something close to the alarmists’ picture for the wider economy, though still with real revenue underneath. The take-aways at the end pull these together.
Toward a more elaborate model
To be fair, this simple toy model leaves out not just the potential for WW3, but also most of what makes a real financial crisis. Some things that could helpfully be added are:
- Balance sheets and contagion, done properly. The model now has one block of levered builders and one pool of lenders with a single cushion. A real version would track who holds the debt, such as private credit funds, insurers, and banks, with their own leverage and cross-exposures. It would include the circular financing between chip vendors, cloud providers, and labs, margin calls on AI stocks, and debt that comes due on a schedule.
- Different kinds of firm. Cash-rich hyperscalers, leveraged compute renters, and model labs fail in different ways. Competition among them decides who captures the revenue and how far margins fall.
- Prices that respond. When there is a glut, compute gets cheaper and usage rises. That feedback would shorten gluts, and it is absent here.
- Realistic investment. Add spending floors, multi-year contracts, and limits from power and chip supply. Supply limits cap how far anyone can overbuild.
- Feedback into the timeline. A deep bust could cut research budgets and delay HLAGI itself. Arrival should be an uncertain event inside the model, with firms anticipating it and a modelled jump in demand afterward.
- Calibration. Fit the stress thresholds to past episodes such as telecom in 2000 to 2002, shale in 2014 to 2016, and the semiconductor cycles. Estimate the growth and volatility parameters from quarterly data.
- The decentralized networks themselves. Model their token funding, their elastic capacity, and their purchases of distressed hardware. That is where the upside of the decentralized case would show up, and this model catches only a sliver of it.
- The wider economy and the state. Replace my crude hit-to-GDP measure with real channels through jobs, credit and asset prices. Model what kind of bailout it is, who pays for it, and how the promise of rescue changes the builders’ behaviour beforehand.
- The race. Let capex be set partly by strategic competition between firms and between nations, as I argued in August, and not only by revenue forecasts.
An agent-based version could combine the first four, at the cost of many more assumptions to defend.
Take-aways…
What I’ve asked here is—under the assumption Big Tech’s bet on HLAGI being near is basically right, what is the economic danger we face from them being wrong on the timing details? The big risk here is in the combination of interest and depreciation: capital that wears out in five years, bought with borrowed money on forecasts that nobody can check, serving customers who adopt in fits and starts.
Having explored all these dimensions, here is where I come out. A global great depression is not likely. If there is a huge global mega-crisis in the coming decade, I think it is more likely to be a military or cybersecurity one than a pure economic crash. That part is my own judgment, and nothing in the model speaks to it. However, the possibility of a full-on economic crash is there. And there is a probably stronger possibility of more moderate economic disruptions, coming and going in fairly rapid waves.
The model’s numbers back each part of that. Start with the waves. At the baseline settings, 92% of the simulated futures have at least one year in which the hit to the wider economy is 1% of GDP or more, and 69% have two or more such years. Nearly half have two or more separate capex busts. These episodes pass quickly, because revenue keeps growing and the hardware wears out. A full-on crash is less likely, but far from negligible: a crisis-sized hit of 3% of GDP in a year has about a one in three chance by 2031. A depression is less likely again. The nearest thing the model has to one is a hit of 10% of GDP or more in a single year. At the baseline that has a 4% chance by 2031 and a 10% chance by 2035. It gets close to an even bet only in the Full Kelly corner, where exuberant planning meets heavy debt, and then only if HLAGI takes until the mid-2030s.
The examples sharpen that picture in six ways.
- The length of the wait sets the odds. At the baseline settings, if HLAGI arrives by 2028 the chance of a crisis-sized hit to the wider economy is about one in twenty. If it takes until 2031 it is about one in three, and by 2035 about one in two. By then the buildout is a large slice of the economy, and even a temporary stall is felt by everyone.
- The starting point matters only if it is much lower than it looks. Anywhere between $200 and $300 billion of AI revenue today, the builders’ risks barely move. At the $100 billion I assumed in August, the builders are in serious trouble at once.
- Optimism and debt are the two dials that matter most, and they compound. Careful planners make credit events and crises rare. Exuberant ones make credit events the norm. Debt works from the other side: it does not cause the forecasting mistake, it decides how hard the mistake lands. With heavy debt the crisis odds for 2031 go from one in three to one in two, and with exuberant planners on top, to four in five.
- Contagion makes the bad outcomes worse more than it makes them more common. The lenders’ cushion holds in most futures. With heavy debt it gives way in about a fifth of paths by 2031, and in most paths only when heavy debt meets exuberant planning. By the time it gives way, the direct damage is usually past the crisis bar already. So in this model the spread of losses through lenders is why the worst cases are very bad, not why crises are frequent. A model with real balance sheets and margin calls might well say otherwise.
- A government bailout protects the economy, not the builders, and it is expensive. A government certain to absorb half the damage cuts the crisis odds by more than half, from 31% to 10% for 2031 at the baseline. Nothing changes inside Big Tech. The bill is on the order of a trillion dollars, and two to four trillion when the builders are heavily indebted. A bailout works best where the hits are modest and worst where the planners were exuberant, and a promise of rescue that makes planners bolder can cancel itself out. The same protection can also be bought in advance, by borrowing less: with heavy debt, a certain bailout and a cut in the builders’ debt share from 75% to 50% give the same crisis odds. As I argued in August, though, the race makes that a hard choice for any one builder.
- Decentralized networks move the risk around, in time and in place. If decentralized AI takes 40% of the market by 2028, the incumbents are hit hard: credit events become close to certain, and systemic stress likely. For the wider economy the first couple of years are rougher, at 16% against 5% for 2028, and the later years safer, at 36% against 51% for 2035. Less of the economy ends up levered to the bet, and the networks can put stranded hardware to work. That result leans on the hardware being reusable and on the networks carrying no debt of their own, and the handover is much rougher if the incumbents are heavily indebted when it happens.
Put together: the technology bet can be right while particular balance sheets are badly wrong. How wrong depends less on the technology than on three human choices: how optimistic the plans are, how much of the bet is borrowed, and who is expected to pay when it stalls.
The degree and nature of the disruptions will depend in complicated ways on all of these factors at once. The model explores their interactions in a fairly simplistic way. I would still say it is much less simplistic than most of the media and pundit discussion one sees, or most of the proclamations from Big Tech CEOs. A more careful, data-driven, agent-based simulation could give a more thorough and accurate picture. But there are limits to how good anyone’s prediction is going to be, given all the unknowns of a radically new technology and of society’s reaction to it.
So if one thinks AGI really is fairly near, the useful economic question is not so much whether there is an AI bubble that’s going to eventually burst. The more interesting question is who can afford to be a little early if implicitly or explicitly assumed AGI timelines are a little overoptimistic. For instance: Firms funding their buildout from cash flow can wait out a glut, whereas those funding theirs with debt may not get the chance. Networks or companies that incorporate a rich and diverse variety of ways of monetizing AI at various levels of maturity can pivot rapidly as technology and markets gradually develop, versus those that are tied to very specific industries or business models that may then turn out to have slower adoption curves than hoped. Etc.