


.png)

.png)


.png)
The Fitbit is the first wearable biosensor that achieved widespread adoption, due to a simple proposition: measure the amount of steps that a person takes in a day. This measurement turns out to be an excellent approximation for fitness level and provides a clear goal to measure against: 10,000 steps a day. How does it measure the steps? The accelerometer measures the movement of the Fitbit and can determine your motion.
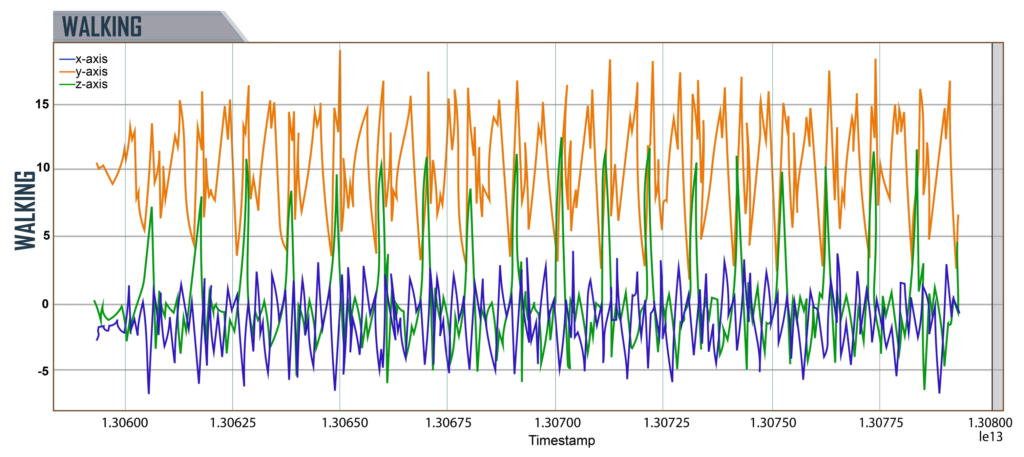
Here is an example of an accelerometer recording someone walking:
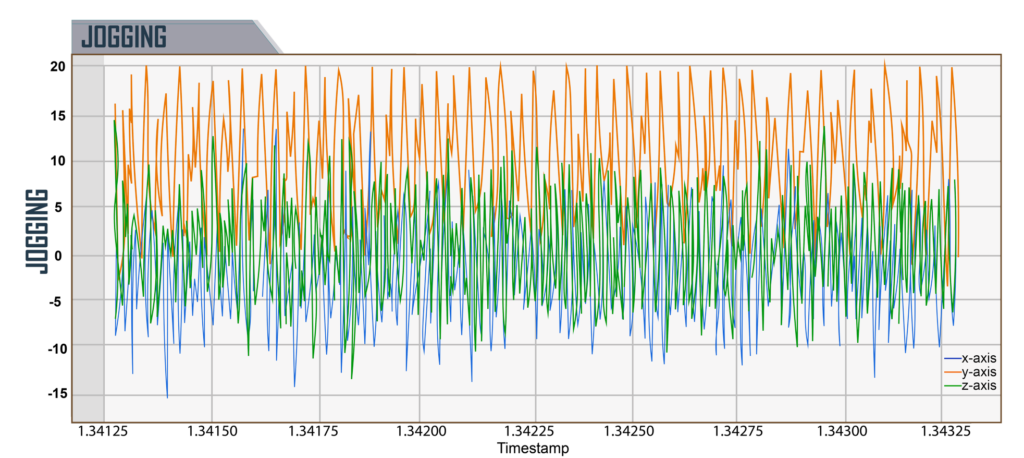
Here is an example of someone jogging – note how different the data looks
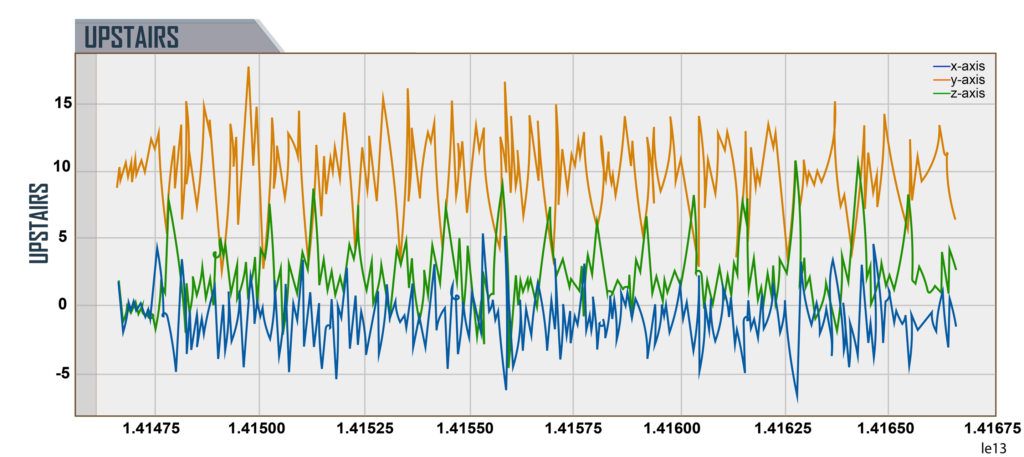
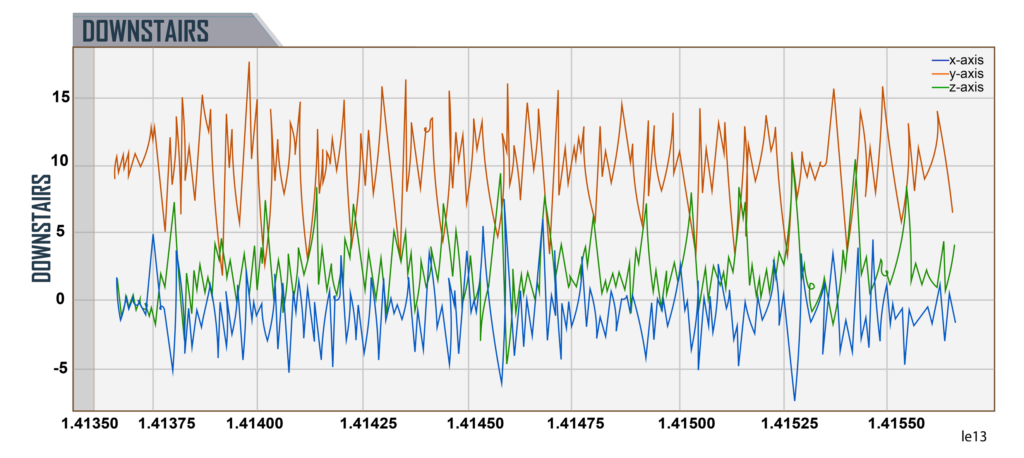
It can tell when you are navigating a flight of stairs, and can tell which way you’re going – climbing up the stairs:
Climbing down the stairs:
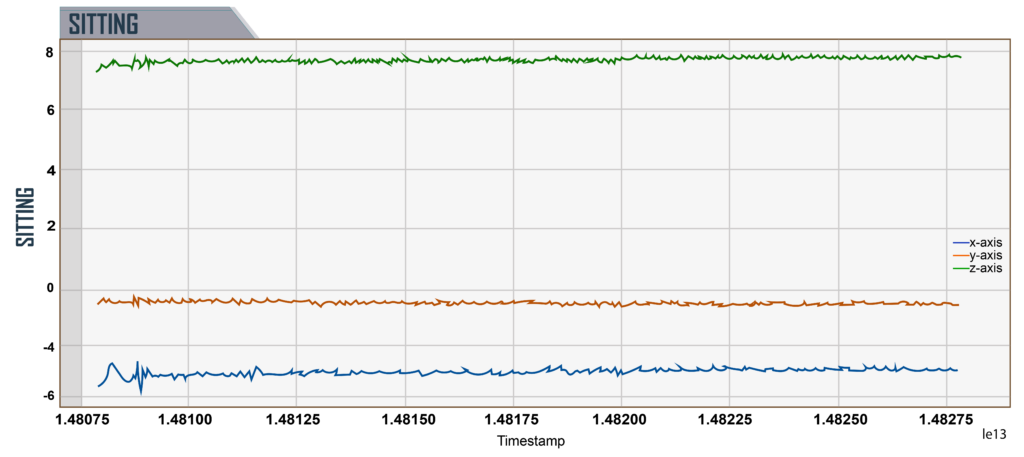
Sitting down:
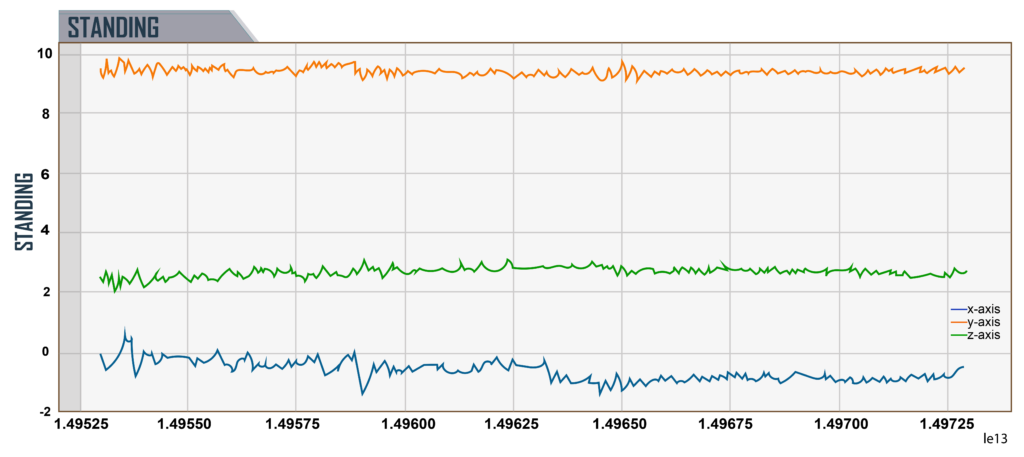
Standing up:
Even with just the accelerometer data above we have a pretty good idea of what the user is doing, but we can go much further. The Fitbit is a combination of sensors working together to paint a richer picture than each one could on its own. It combines an accelerometer, a gyroscope, an altimeter, a GPS, a heart rate sensor, electrical sensors that can measure skin conductivity, skin temperature, ambient light, and a microphone. These are all fairly low cost, straightforward sensors – and their applications are well known and have been used for decades.
Let’s look at just two of these sensors and how they work together. The first sensor is the accelerometer, which measures the motion of the device on three axes. From the motion readings generated, the user’s activity and motion can be identified: whether they are sitting, standing, walking, jogging, or navigating a set of stairs.
Each type of movement generates a distinct set of readings, so it’s possible to infer state from something as imprecise and simple as a device accelerometer. Correlating just this single sensor with a bit more information can be quite powerful – if a user’s phone tends to show consistent motion until 11pm at night, at which point it remains completely stationary for 7-8 hours and starts moving again in the morning, we can be reasonably confident that this is when the user is sleeping, despite not being able to measure it directly.
Let’s combine the accelerometer with another sensor that measures heart rate. Now we can not only measure the amount of motion that the user is engaging in, but the amount of effort that motion requires. Let’s ask a series of questions and consider each sensor, and what we get from them by themselves, compared to where we can get by combining them.
Using the data from these sensors:
Are you walking up a hill?
An accelerometer alone can answer this question, because it measures motion state and can infer things like how quickly you are walking, climbing, or running.
A heart rate sensor only measures your heart rate, so it can’t tell you what activity is actually causing your heart rate to go up or down.
Are you expending significant effort to walk up the hill?
The accelerometer can “know” that you are walking, but it cannot tell you how much effort you are expending.
The heart rate sensor can answer how much effort you are expending in any given moment, but it does not allow us to determine activity type very easily.
But when used together, we can show heart rate increase is being caused from climbing the hill. After the accelerometer shows the climbing has stopped, the heart rate monitor can measure the amount of time it takes the heart rate to return to normal. So using both sensors together helps form a much richer and more comprehensive picture than the accelerometer or heart rate monitor alone.
Let’s consider one more case, where we have the Fitbit’s GPS information. If we combine this information now, we can determine motion type from the accelerometer, level of effort from the heart rate meter, and location change from the GPS. Now we can know what hill the person climbed, when, and exactly how much effort the person expended. A hiker with a GPS alone could provide some of this information, but as we can see above, adding low cost sensors and correlating them has a powerful additive effect.
Combining multiple types of measurements and correlating them is something most of us are familiar with. When we go to the doctor’s office for an annual exam, there’s a series of tests that we will undergo. Our height and weight are recorded. Our skin temperature is measured, along with our heart rate and blood pressure. This provides a baseline for comparison with any changes we experience over time. These measurements are correlated and used to determine whether any unexpected shifts are happening. It’s by merging these measurements together that we can form a rich picture of our physical health and be confident in our analysis.
A recent evolution of these fitness trackers is the Whoop band, a competitor to Fitbit. It measures similar things like sleep, heart rate, and motion – with a more targeted goal of delivering feedback to the athlete on their current training readiness.
The Whoop band measures Heart Rate Variability as an indicator of physical strain and recovery from physical strain. Heart Rate Variability (HRV) is a metric that looks at the amount of variation in the intervals between a person’s heart beats. High Heart Rate Variability is considered desirable, and is a measure of physical recovery and/or stress.
By combining these low-cost sensors, the platform is able to calculate remarkably complex things about the wearer. It has enabled people to understand their bodies in new ways, from their sleep quality to the level of strain they experience while doing various exercises. After the workout the heart rate will rise and get more steady – both signs that the body is recovering from the strain. From the amount of change in heart rate, the app can determine where the user is in their recovery, and indicate whether to continue resting, engage in light exercise, or to work out at full intensity.
We are now at a point where a $200 device can passively measure things about your fitness and derive insights that ten years ago would have only been available to professional athletes. An array of simple, low cost sensors in a consumer device can provide the information people need to make effective and safe training decisions. Fitbit and Whoop showed how combining multiple sensors gave users new insights into their physical health; in the future, it will be possible to combine various other sensors to give users insights into their cognitive health.
So when talking about neuroscience and the coming revolution in our ability to measure ourselves, our internal states, and our body, what sensors are involved with that? It starts with the same biometric sensors we’re using currently in Fitbits and Apple Watches – skin temperature, heart rate, motion tracking. To that we add a few more that have been used extensively in research but are recently arriving in the consumer/low-cost sensor space, namely eye tracking, electroencephalography (EEG), and galvanic skin response.
Eye Tracking
With an eye tracking sensor bar or a VR headset, this sensor can tell where you are looking. Depending on the sensor, it will also be able to determine the size of your pupils – these expand and constrict with changes in “cognitive load.” (Note that pupil size can also mean other things, such as a reaction to brightness or outright fear.)
Cognitive Load is the concept that the brain has finite resources and will allocate them as needed – in the same way that your heart and lungs have physical limits on their performance. Pupil size, which can be measured from an eye tracker, is an excellent measurement of cognitive load. Thus, an eye tracker knows what you are looking at, and can also determine how intensely you are processing that object.
What can we do with this information? Imagine you’re a consumer goods company that is about to purchase a 30 second superbowl ad for $6 million. The commercials cost roughly $300,000 to produce. Why not produce three and find the one that consumers respond to the most? With an eye tracker, have some consumers look at the different ad versions. From that, run whatever commercial causes people to look at the product the most times, and spend the most time lingering on the product.
What doesn’t the eye tracker tell us? Anything else, really. How the person feels about the product, what brain state it evokes, how intensely they feel that way. What if they’re staring at it because they really dislike it? While that is engagement, it is perhaps not the kind of engagement wanted. While the eye tracker has an amazing ability to tell us what someone is looking at and how hard their brain is working, it won’t give us a complete picture. It’s accurate but partial.
Galvanic Skin Response (GSR)
Skin conductivity is responsive to emotional state. As an emotional experience gets more intense, a person’s skin conducts electricity better. It can be hard to directly measure whether that emotional response is positive or negative (though that can often be easily guessed).
If we were to run a study with the eye tracker alone, we could use the metrics it provides to get a good understanding of which products seem to appeal to consumers visually. We can also gain an understanding of how people engage with products they find visually appealing, by quantifying the difference in fixation order, fixation length, and gaze sequence between the products. Using pupil size, we can infer how much work their brain did processing the object they were looking at.
We cannot make statements about how the person felt emotionally about the object they were looking at using only the eye tracker.
However, if we were to run a study with the GSR meter alone, we could use the metrics it provides to get a good understanding of the emotional response people have, say, to a commercial. We don’t have a good way to distinguish which products generate which response, though we can partially infer it from looking at the way the GSR response changes during the 30 second commercial and whether the three commercials drive fundamentally different responses. Basically, we know how they feel, but we don’t know what they’re looking at, as they have that emotional response.
Now, if we combine these two sensors, there will be some initial difficulty reconciling this data. Eye trackers and GSR meters operate at different sample rates, but also at different timescales. These various physiological processes have different response times and different ways of presenting. 30 seconds is a lot of data for an eye tracker, but a small amount for a GSR meter. Combining sensors often starts with revisiting the experimental design to work with the strengths of both sensors. In this case, 30 seconds is still sufficient for doing this comparison, so we can proceed.
We need a new interpretation that includes both sensors. When we were just looking at the eye tracking, we defined “this person favors the desired object” as the success criteria. When we were just looking at the GSR, we defined “this person has the strongest emotional response” as the success criteria. Now we’re going to define “This person favors the desired object while having the strongest emotional response” as the success criteria.
From the eye tracker, we know what object a person is observing at any given moment. From the GSR meter, we know the intensity of the response. Now we can merge the two metrics, and see how much they agree with each other. If we find that the object the person looks at the most also generates the strongest emotional response, it would provide a very clear signal that they are interested in that object.
What if we find that there isn’t a clear relationship between the amount of time spent looking at an object and the emotional response? In that case, we would need to come up with a ‘tie breaker’ to resolve the contradiction. We could use another sensor – by adding facial expression tracking to the mix, we would have a clear idea of whether the emotion was pleasurable or not, and resolve inconsistencies between the eye tracker and GSR meter.
In some cases, we will not be able to come up with a clear relationship between the sensors, even if they are painting complimentary pictures of the data. In other cases, we will be able to come up with a clear relationship that we can apply to future experiments.
Finally, let’s step through the two scenarios above:
- We run the combined eye tracking and GSR study for our food manufacturer.
- We find that commercial #2 generates the most fixations on their product.
- We also find that commercial #2 generates the longest gaze linger time on their product.
- Finally, we find that commercial #2 generates the strongest emotional response overall, as well as during the times that the customer is looking at the product.
In this case, we can expect the food manufacturer to air commercial #2 during the Superbowl and hopefully receive a strong response. If that’s the case, we can build on our understanding and help companies find the most effective messaging to consumers.
Let’s consider the other scenario, where we run the combined eye tracking and GSR study and get slightly contradictory data.
In this case, we find that:
- Commercial #3 generates the strongest emotional response overall.
- Commercial #1 generates the most fixations and the longest linger time on their product.
So, in this case, we would need to make a decision regarding which sensor is considered more representative or useful in this case. Do we trust the conclusion from the GSR sensor which points to commercial 3? Do we trust the conclusion from the eye tracker which points to commercial 1? Or do we add another sensor to help clarify?
As we can see, fusing sensor data is helpful and informative. When sensors agree, it lends significant credibility to the metrics they generate as they often involve quite different processes. When sensors disagree, it can be a great hint that there are discrepancies in the experimental design or the expected understanding of the phenomenon being studied.
This approach to combining data is called Data Triangulation, and allows for robust and reliable findings when combining data from multiple sensors and paradigms.
The explosion of low cost sensors, internet-connected devices, cloud computing, and affordable wearables is bringing a revolution in our ability to collect data about ourselves, gain actionable insights, and make life better for human beings everywhere. By fusing the data from the sensors together, powerful analytical insights become available. By fusing the data we collect, even further insights are possible. And by triangulating across different methods, we can be confident in our conclusions. Now let’s take a closer look at all the different kinds of sensors available, in our Sensor Fusion Guide.
Let us know your thoughts! Sign up for a Mindplex account now, join our Telegram, or follow us on Twitter.