


.png)

.png)


.png)

Ten Key Crypto Technical Indicators for Beginners To Know in 2024
Jun. 27, 2024. 7 min. read.
 Interactions
Crypto trading mastery: what are the essential indicators for successful Crypto Traders. Werner V. explores the 10 most crucial crypto trading indicators that every aspiring crypto trader should master.
Note from the editor: This is not financial advice. The claim that technical indicators predict future price movements better than chance has not been validated by Mindplex.
The Bitcoin halving has come and gone, and crypto markets are in the doldrums of summer. Explosive growth has settled into a cruise, presenting the perfect opportunity to master an important component of crypto investment success: technical indicators, which are tools used to perform technical analysis (TA).
Are you new to the world of cryptocurrency trading and feeling overwhelmed by the sheer number of technical indicators available? Or you’re an inexperienced investor that just can’t figure out what’s going to happen next? That’s because the crypto market is dominated by short-term trading, mostly with bot trading tools, that look at specific indicators to devise an optimal strategy. Therefore, while you don’t have to be a pro trader, you should at least know the rules of the trading game before you invest in shorter time frames.
In this article, I’ll cover ten important crypto trading indicators that any crypto trader can try and master in 2024 to manage their Bitcoin and Ethereum. These indicators (which I’ll explain in descending order of importance) will help you make more informed trading decisions in the dynamic crypto market.
It’s important to note that no single indicator should be viewed in isolation. Instead, traders should use a combination of indicators to confirm signals and make more informed decisions. By using multiple indicators together, you can gain a more comprehensive understanding of market trends, potential entry and exit points, and overall market sentiment.

1. Moving Averages
What is a Moving Average?
A moving average is a technical analysis tool that smooths out price data by creating a constantly updated average price over a specific period.

What does it do?
Moving averages help identify trends and potential support and resistance levels. They can also serve as a foundation for other technical indicators.
How it works
The two most common moving averages are the simple moving average (SMA) and the exponential moving average (EMA). An SMA is calculated by taking the average price over a set number of periods – while an EMA gives more weight to recent prices.
2. Relative Strength Index (RSI)
What is a RSI?
The Relative Strength Index (RSI) is an unmissable momentum indicator that measures the speed and magnitude of price changes. Its stochastic RSI variant is said to provide an easy visual way to see whether prices are bottoming or topping.
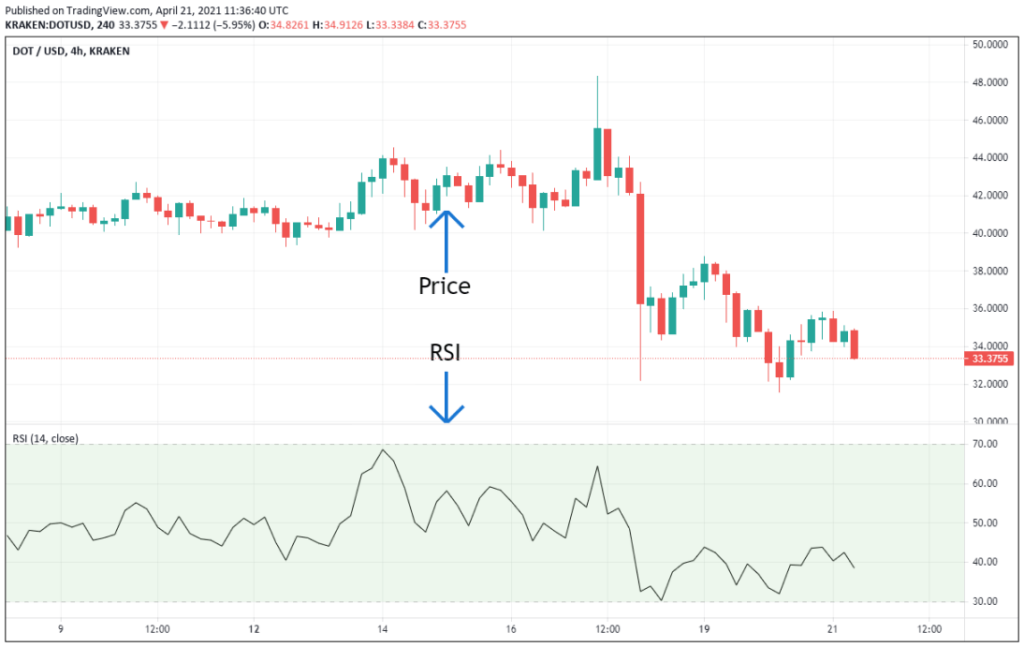
What does it do?
RSI helps identify overbought and oversold conditions, which can signal potential reversals or trend confirmations.
How it works
RSI oscillates between 0 and 100. Readings above 70 suggest an overbought condition, while readings below 30 indicate an oversold condition.
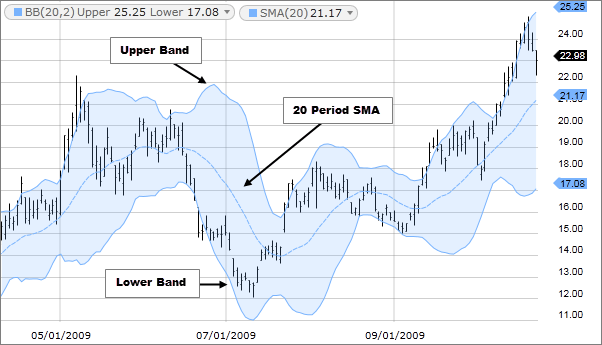
3. Bollinger Bands
What are Bollinger Bands?
Bollinger Bands are volatility indicators that consist of a middle band (typically a 20-day SMA), plus two outer bands set two Standard Deviations above and below that middle band.
What does it do?
Bollinger Bands help identify potential overbought and oversold conditions, as well as potential breakouts when the price moves outside the bands.
How it works
When the price touches the upper band, it’s considered overbought, and when it touches the lower band, it’s considered oversold. A squeeze in the bands often precedes a breakout.
4. Fibonacci Retracement
What is a Fibonacci Retracement?
Degen traders’ favorite tool of choice, Fibonacci retracement levels are based on the controversial Fibonacci sequence and are used to identify potential support and resistance levels.
What does it do?
Fibonacci retracement levels allegedly help traders set price targets and determine entry and exit points.
How it works
The most commonly used Fibonacci retracement levels are 23.6%, 38.2%, 50%, 61.8%, and 78.6%. These levels are plotted on a chart by drawing a line from a swing high to a swing low (or vice versa) and then dividing the vertical distance by the key Fibonacci ratios.
5. On-Balance-Volume (OBV)
What is an OBV?
On-Balance-Volume (OBV) is a volume-based indicator that helps confirm price trends and predict potential reversals.
What does it do?
OBV can help identify divergences between price and volume, which can signal a potential trend reversal.
How it works

OBV adds or subtracts volume based on whether the price closes higher or lower than the previous day. If OBV is rising while the price is flat or declining, technical analysts claim that suggests a potential price increase, and vice versa.
6. Moving Average Convergence Divergence (MACD)
What is a MACD?
The Moving Average Convergence Divergence (MACD) is a trend-following momentum indicator that shows the relationship between two moving averages.
What does it do?
MACD helps identify trend changes, momentum, and potential buy and sell signals.
How it works
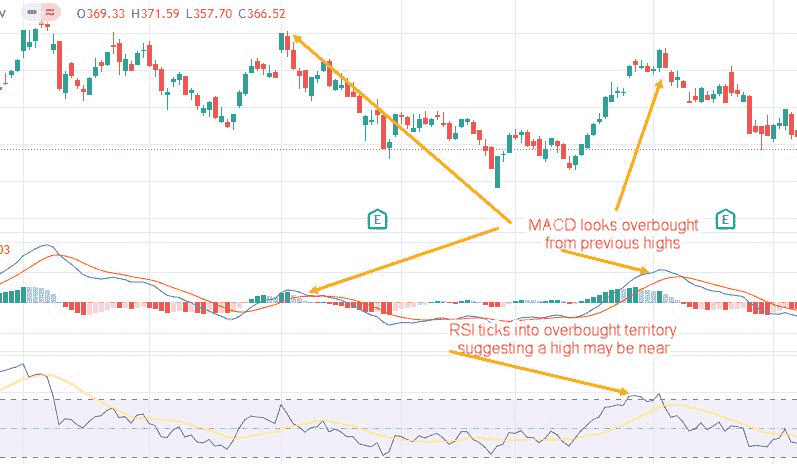
MACD consists of a MACD line (the 12-day EMA minus the 26-day EMA) and a signal line (a 9-day EMA of the MACD line). When the MACD line crosses above the signal line, it’s a bullish signal, and when it crosses below, it’s a bearish signal.
7. Stochastic Oscillator
What is a Stochastic Oscillator?
The Stochastic Oscillator is a momentum indicator that compares the closing price of an asset to its price range over a specific period.
What does it do?
The Stochastic Oscillator helps identify overbought and oversold conditions and potential reversals.
How it works

The indicator consists of two lines: %K and %D. When %K crosses above %D, it’s a bullish signal, and when it crosses below, it’s a bearish signal. Readings above 80 suggest an overbought condition, while readings below 20 indicate an oversold condition.
8. Ichimoku Cloud
What is an Ichimoku Cloud?
The Ichimoku Cloud is a comprehensive indicator that provides a quick overview of an asset’s price action, trend direction, and potential support and resistance levels.
What does it do?
The Ichimoku Cloud helps traders identify the prevailing trend, gauge momentum, and spot potential buy and sell signals.
How it works
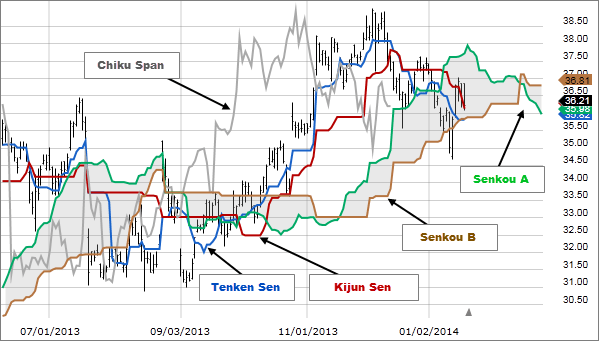
The Ichimoku Cloud consists of five lines: the Tenkan-sen, Kijun-sen, Senkou Span A, Senkou Span B, and the Chikou Span. When the price is above the cloud, it’s considered bullish, and when it’s below the cloud, it’s considered bearish.
9. Aroon Indicator
What is the Aroon Indicator?
The Aroon Indicator is designed to identify trend changes and measure the strength of a trend.
What does it do?
The Aroon Indicator can help traders spot trend changes and potential entry and exit points.
How it works
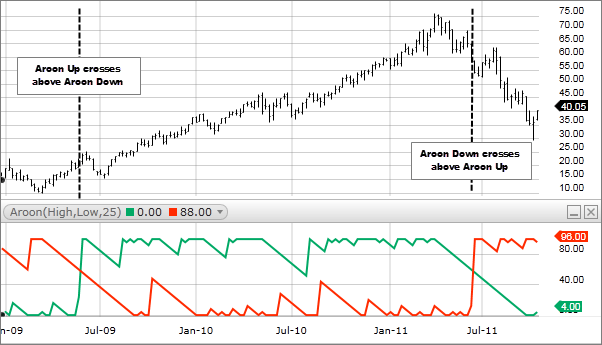
The indicator consists of two lines: the Aroon Up and the Aroon Down. When the Aroon Up is above the Aroon Down, it indicates an uptrend, and when the Aroon Down is above the Aroon Up, it indicates a downtrend.
10. On-Chain Metrics
What are On-Chain Metrics?
On-chain metrics provide valuable insights into the fundamental health and activity of a cryptocurrency network. Looking at data such as total market cap, circulating supply, fully diluted value, total value locked, dApp activity, transaction count, user activity and more can help you see through all the smoke and mirrors in a bull market.
What do they do?
By monitoring on-chain metrics, traders can gauge the overall sentiment and growth potential of a particular cryptocurrency.
How it works
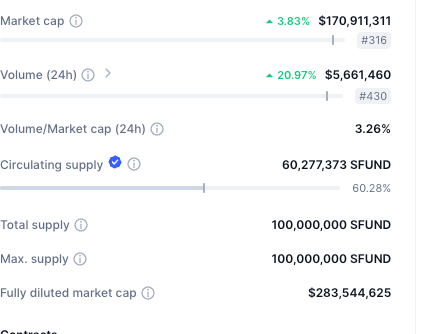
Some important on-chain metrics include transaction volume, active addresses, network value to transaction ratio (NVT), and realized cap. These metrics can be tracked using various blockchain explorers and analytics platforms.
Conclusion
In conclusion, these ten essential crypto technical indicators provide a powerful foundation for beginner traders in 2024, but it’s good to keep in mind that it barely scratches the surface of what’s possible in technical analysis.
You can test out applying these indicators for yourself, and see if they help you make more informed trading decisions or improve your chances of success in the dynamic crypto market.
However, it’s crucial to remember that no single indicator is perfect, and relying on just one can lead to suboptimal results. Maybe using a combination of indicators to confirm signals will help you gain a more comprehensive understanding of market trends and sentiment.
As you continue your trading journey, stay committed to continuous learning and adapting to the ever-changing crypto landscape. With dedication and practice, you’ll be well on your way to becoming a proficient trader in the exciting world of cryptocurrencies.
Let us know your thoughts! Sign up for a Mindplex account now, join our Telegram, or follow us on Twitter.


0 Comments
0 thoughts on “Ten Key Crypto Technical Indicators for Beginners To Know in 2024”